geom_GeomGeneArrow() and geom_GeomFitText() has yet to be implemented in plotly [shapviz]
Recently I started working with the new shapviz package. In particular, the waterfall plot was working just fine for what I needed to visualise. Unfortunately, I was unable to use ggplotly to render the plots in plotly.

As it turns out, the waterfall plot is different from plotly's waterfall chart as it is built on the GeomGeneArrow geom from from https://github.com/wilkox/gggenes.
Warning message in geom2trace.default(dots[[1L]][[1L]], dots[[2L]][[1L]], dots[[3L]][[1L]]):
“geom_GeomGeneArrow() has yet to be implemented in plotly.
  If you'd like to see this geom implemented,
  Please open an issue with your example code at
  [https://github.com/ropensci/plotly/issues](https://github.com/ropensci/plotly/issues)
In addition, geom_GeomFitText, which is needed for rendering text over plot elements is also unimplemented.
geom_GeomFitText() has yet to be implemented in plotly.
  If you'd like to see this geom implemented,
  Please open an issue with your example code at
  [https://github.com/ropensci/plotly/issues](https://github.com/ropensci/plotly/issues)
Reprex adapted from the default shapviz example below:
#library imports
install.packages("shapviz")
library(shapviz)
library(ggplot2)
library(xgboost)
set.seed(3653)
X <- diamonds[c("carat", "cut", "color", "clarity")]
dtrain <- xgb.DMatrix(data.matrix(X), label = diamonds$price)
fit <- xgb.train(
params = list(learning_rate = 0.1, objective = "reg:squarederror"),
data = dtrain,
nrounds = 65L
)
X_small <- X[sample(nrow(X), 2000L), ]
shp <- shapviz(fit, X_pred = data.matrix(X_small), X = X_small)
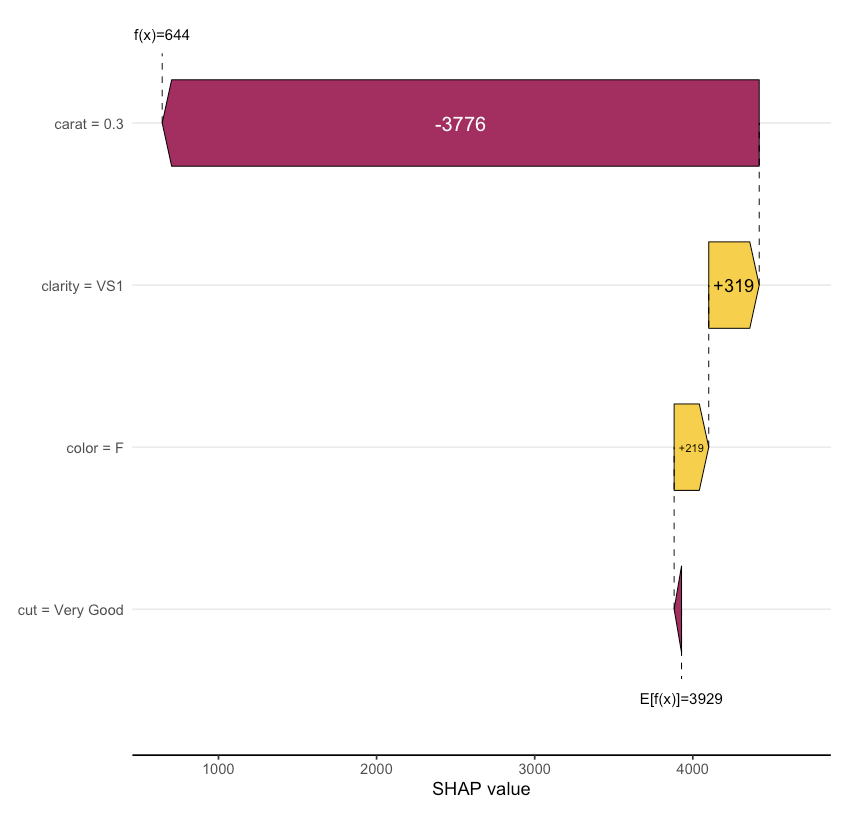
waterfall_plot <- sv_waterfall(shp, row_id = 1)
library(plotly)
ggplotly(waterfall_plot)
Expected Output should render similar to this (original ggplot):
@madprogramer : Thanks for pushing this! I'd love to see these geoms available. The current release of "shapviz" at least plays well together with plotly regarding the dependence plot and the (new) default importance plot.
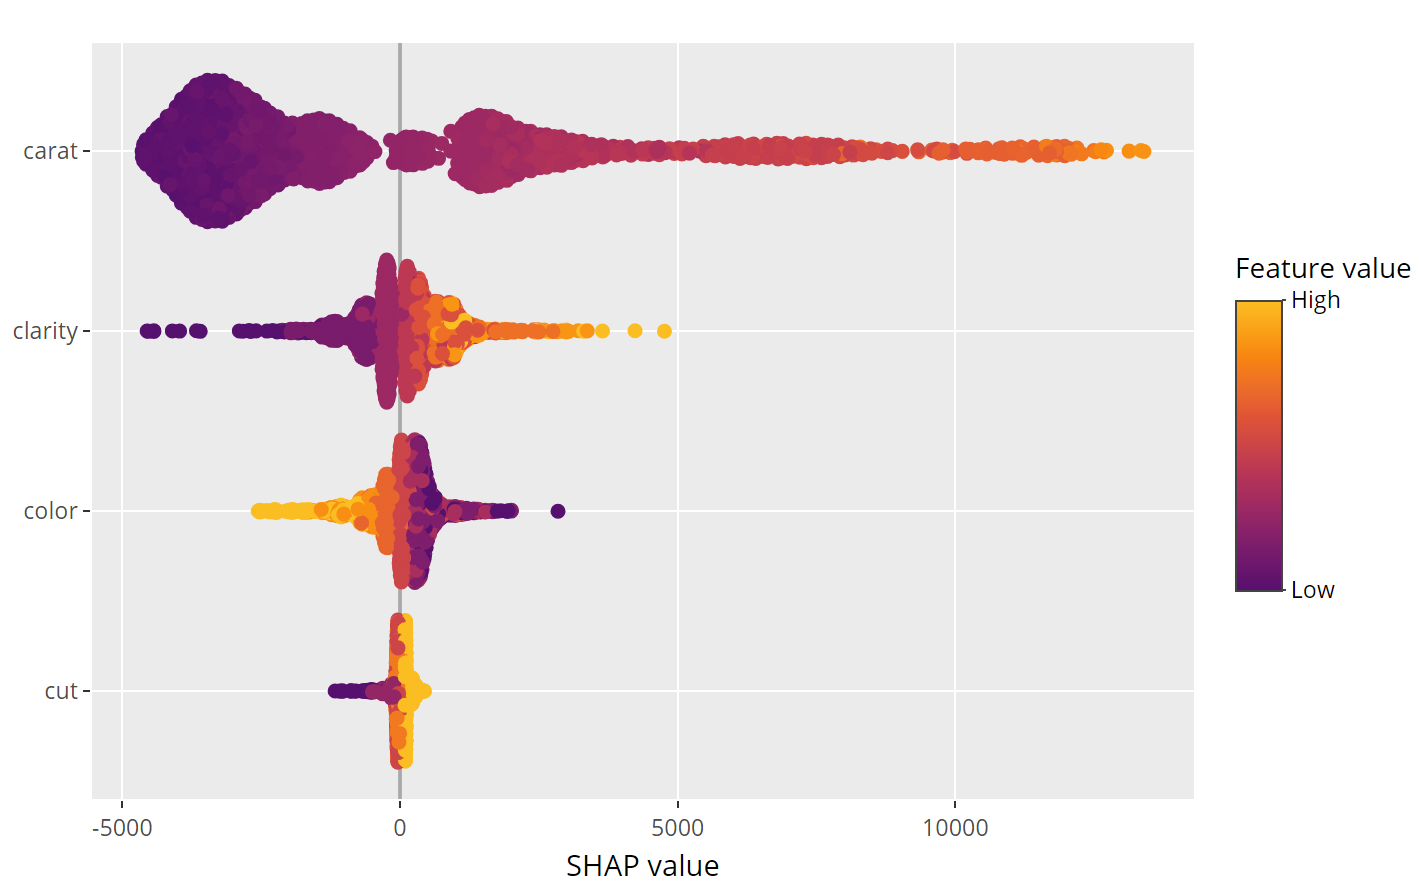
@madprogramer In the upcoming v.0.4.0 of "shapviz", I have written from scratch the beeswarm visualization in sv_importance() . Since it is now built on top of geom_point(), the beeswarm plot will also work with Plotly:
...
# First plot
sv_importance(shp, kind = "beeswarm")
%>% ggplotly()
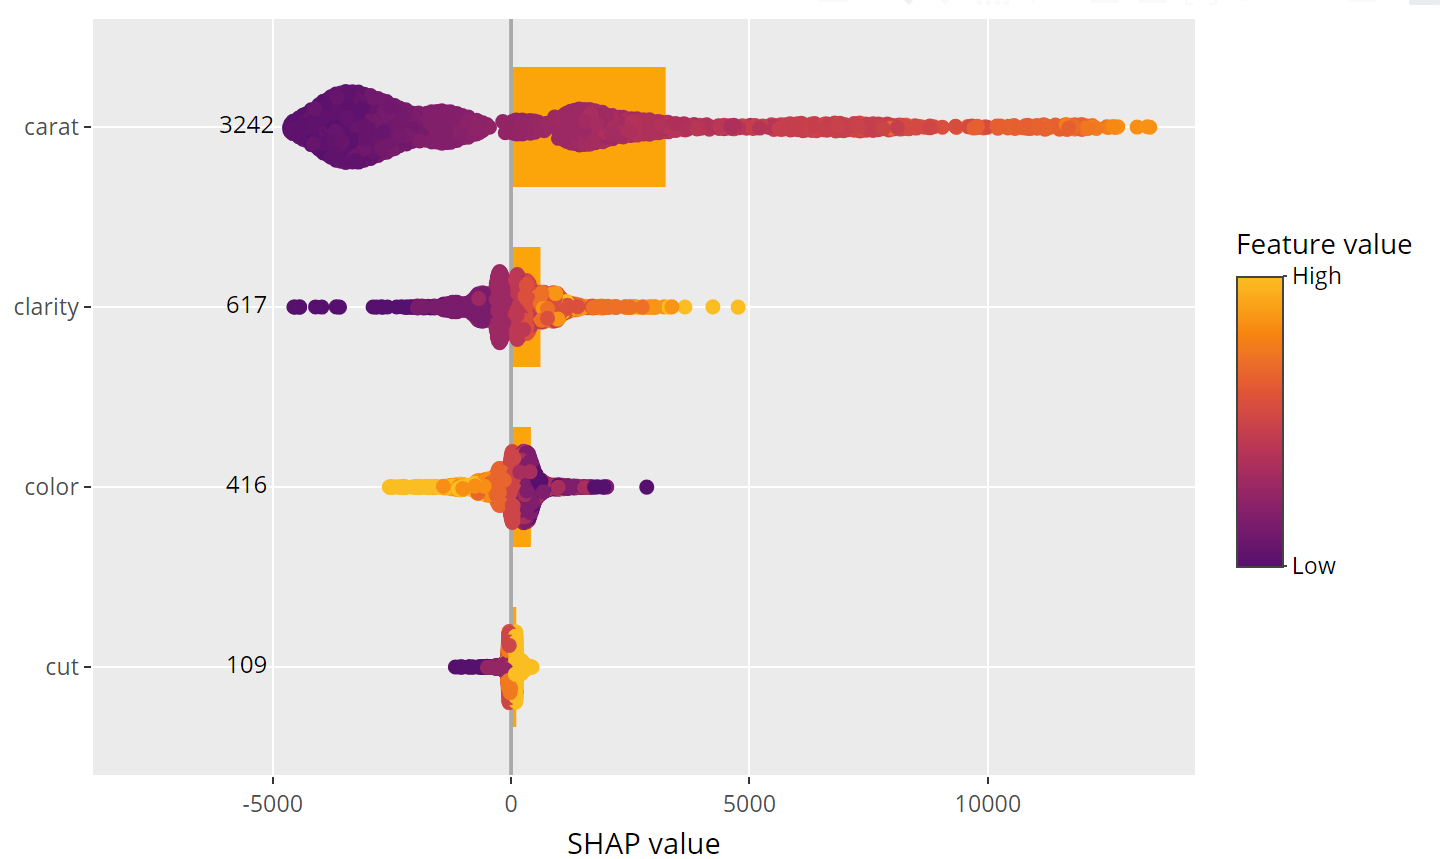
# Second plot
sv_importance(shp, kind = "both", bee_width = 0.2, show_numbers = TRUE)
%>% ggplotly()
https://github.com/mayer79/shapviz/tree/beeswarm
(merged to the main branch).