plotly.R

plotly.R copied to clipboard
Customdata format variations
There seems to be a lot of variations regarding the format in which the customdata is structured.
Showcase:
library(plotly)
library(htmlwidgets)
js <- "function(el, x) {
el.on('plotly_click', function(d) {
console.log(d);
console.log(d.points[0].data.customdata[0]);
});
}"
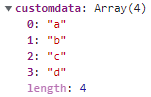
X <- data.frame(x = c(1, 2, 1, 2), y = c(1, 1, 2, 2), z = as.character(1:4), mydata = letters[1:4])
gg <- ggplot(X, aes(x = x, y = y, customdata = mydata)) + geom_tile(aes(fill = z))
ggplotly(gg) %>% onRender(js)
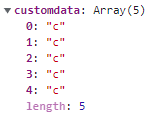
Same as above, except z is now numerical:
X <- data.frame(x = c(1, 2, 1, 2), y = c(1, 1, 2, 2), z = 1:4, mydata = letters[1:4])
More information in this Stackoverflow post.