FR: add a root_color option for treemap traces
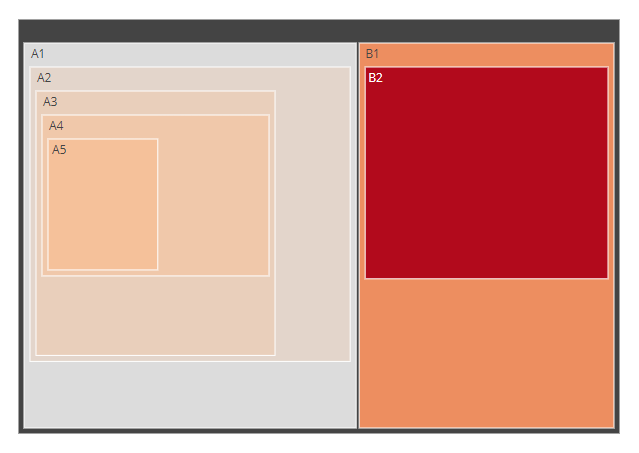
When using a colorscale on a treemap trace (without providing a root) the container is shown in black:
library(plotly)

labels = c("A1", "A2", "A3", "A4", "A5", "B1", "B2")
parents = c("", "A1", "A2", "A3", "A4", "", "B1")
values = c("11", "12", "13", "14", "15", "20", "30")

fig <- plot_ly(
  type="treemap",
  labels=labels,
  parents=parents,
  values=values,
  marker=list(colorscale='Reds'))

fig
Example taken from here: https://plotly.com/r/treemaps/
I'd like to change it to white.
In the python plotly library there is a root_color argument to do so:
fig.update_traces(root_color="lightgrey")
see: https://plotly.com/python/treemaps/
It would be great to have the same option in R.
Or is there any workaround to achive this?
The "root" key is already listed in the R Figure Reference for treemap traces: https://plotly.com/r/reference/treemap/#treemap-root
sets the color of the root node for a sunburst/treemap/icicle trace. this has no effect when a colorscale is used to set the markers.
I tried the following workaround, which works fine for the opacity but not for the root color (not using a colorscale):
library(plotly)
library(htmlwidgets)

js <- "
       function(el, x){
        Plotly.restyle(el, {'root':{color:'blue'}}, [0]);
        // Plotly.restyle(el, {'root':{color:rgba(0,0,255,0)}}, [0]);
        Plotly.restyle(el, {'opacity':0.4}, [0]);
       }
      "

fig <- plot_ly(
  type="treemap",
  labels=c("Eve", "Cain", "Seth", "Enos", "Noam", "Abel", "Awan", "Enoch", "Azura"),
  parents=c("", "Eve", "Eve", "Seth", "Seth", "Eve", "Eve", "Awan", "Eve")
)

# fig$x$attrs[[1]] <- c(fig$x$attrs[[1]], list(root = list(color = "lightgrey")))

jsFig <- onRender(fig, js)
jsFig
Hi, Were you able to solve the problem with the black root node? I am facing the same problem and have not found a solution.
Hi @jantau,
I'm now using the marker.colors / treemapcolorway option to pass a custom colorpalette.
This way the root color is white (as shown here).
An example:
library(plotly)

labels_mat <- mapply(rep, 1:4, 4)
labels <- paste0(LETTERS[as.vector(labels_mat)], as.vector(t(labels_mat)))

parents_mat <- mapply(rep, 0:3, 4)
parents <- gsub(".*0", "", paste0(LETTERS[as.vector(labels_mat)], as.vector(t(parents_mat))))

values <- seq_along(parents)
max_value <- max(values)

palette <- colorRampPalette(c("green", "yellow", "red"), alpha=TRUE)(max_value)
assigned_colors <- c(palette[cut(values, max_value)])

# using marker.colors
fig <- plot_ly(
  type="treemap",
  labels=labels,
  parents=parents,
  values = values,
  marker=list(colors = assigned_colors))
fig

# same procedure can be used with treemapcolorway
# fig <- fig %>% layout(treemapcolorway=c("pink","lightgray"))
# fig

Hi @ismirsehregal, Thank you for the solution! It looks great. My workaround in the meantime was to embrace the root node by assigning it a label and a value. That works, too, because the colors in my treemap represent the (grouped) mean of the values and the root node color represents now the overall mean (see picture).

@jantau Good that you've found a solution that works for you! I also tried this option, but in my case the root value is the sum of all branches and therefore was much bigger than all the branch values. Accordingly all branches had a similar similar color (bottom of the scale) and the root had the max. color, which wasn't desirable.
Agree with this request. A root color option would benefit graphs with low distinction betwwn leaves with similar values to the root.