documentation

documentation copied to clipboard
Parallel coordinate examples not working (R)
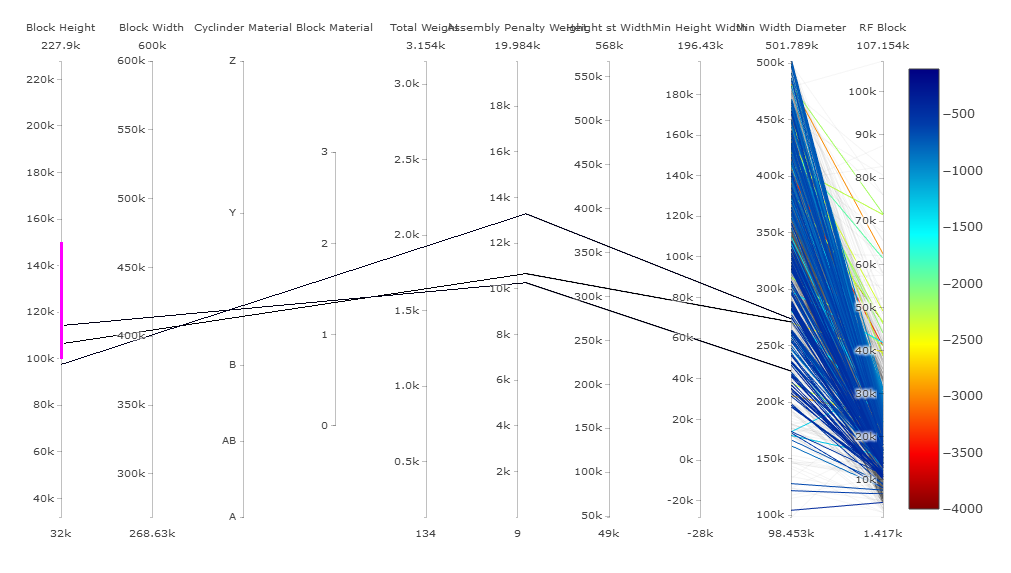
The examples for parallel coordinate plots from here do not render properly for me. All of the data is bunched up on the last two sections of the plot. For instance, here is how R Studio is rendering the 'Advanced Parallel Coordinates Plot':
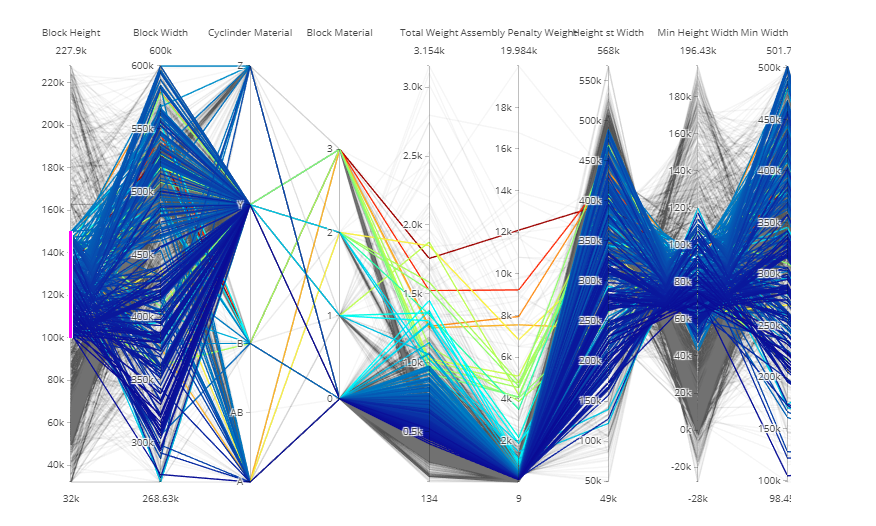
For reference, this is what it looks like on the documentation page:
Here are the relevant version numbers for the software and libraries:
R-Studio: v 1.1.463 R: v 3.5.2 (64 bit) plotly: v 4.9.0
Here's the output of sessionInfo()
R version 3.5.2 (2018-12-20)
Platform: x86_64-w64-mingw32/x64 (64-bit)
Running under: Windows >= 8 x64 (build 9200)