dashR

dashR copied to clipboard
R: incorrect colors with when column contains 'NA'
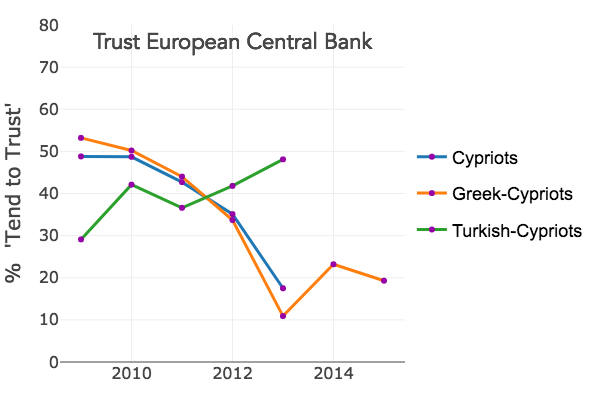
When columns contain 'NA' values, then Plotly changes the colors that I assign for the lines and markers. Any ideas on how to fix this? Thank you! (I am using R version '3.6.0 (2019-04-26)' and Plotly version ‘4.9.0’)
The data for the first graph contains some 'NA' values for the 'trust_ecb' column which is plotted on the y-axis. The colors for the lines and markers are incorrect, i.e. different than the colors assigned in the code.
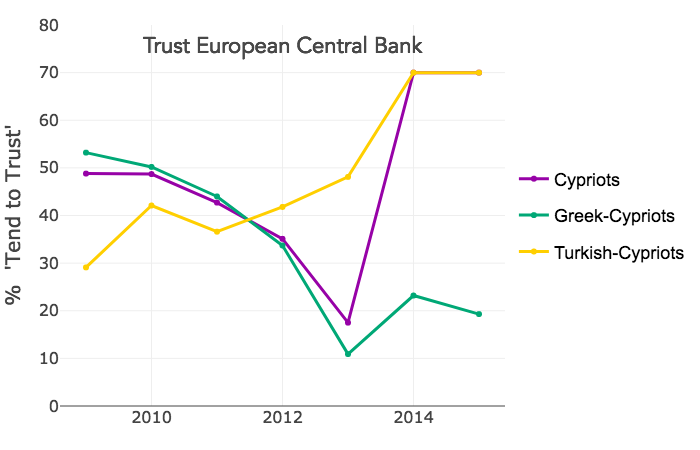
However, when I then recode the 'NA' values to '70', and plot the graph, then the colors are correct.
#Creating dataframe
trust_eur_cyp <- structure(list(year = c(2009L, 2010L, 2011L, 2012L, 2013L, 2014L,
                2015L, 2009L, 2010L, 2011L, 2012L, 2013L, 2014L, 2015L, 2009L,
                2010L, 2011L, 2012L, 2013L, 2014L, 2015L), group = structure(c(4L,
                                                                               4L, 4L, 4L, 4L, 4L, 4L, 5L, 5L, 5L, 5L, 5L, 5L, 5L, 1L, 1L, 1L,
                                                                               1L, 1L, 1L, 1L), .Label = c("Cypriots", "EU-15", "EU-25", "Greek-Cypriots",
                                                                                                           "Turkish-Cypriots"), class = "factor"), trust_ecb = c(53.2, 50.2,
                                                                                                                                                                 44, 33.7, 10.9, 23.2, 19.3, 29.1, 42.1, 36.6, 41.8, 48.1, NA,
                                                                                                                                                                 NA, 48.8, 48.7, 42.7, 35.1, 17.5, NA, NA)), row.names = c(6L,
                                                                                                                                                                                                                           7L, 8L, 9L, 10L, 11L, 12L, 21L, 22L, 23L, 24L, 25L, 26L, 27L,
                                                                                                                                                                                                                           36L, 37L, 38L, 39L, 40L, 41L, 42L), class = "data.frame")


#Creating plots
library(plotly)

plot_trust_ecb_cyp <- plot_ly(trust_eur_cyp, y = ~trust_ecb, x= ~year, color = ~group, type = "scatter",
                      mode = "lines+markers",
                      line = list(color = factor(trust_eur_cyp$group, labels = c("FFCF00","9702A7","00A876")), width = 3),
                      marker = list(color = factor(trust_eur_cyp$group, labels = c("FFCF00","9702A7","00A876")), size = 6),
                      legendgroup = ~group, showlegend = T) %>%
  layout(yaxis = list(title = "%  'Tend to Trust'", titlefont=list(size=20), range = c(0,80), tickfont = list(size = 16)),
 xaxis = list(title = "", dtick = 2, tickfont = list(size = 16)))

#Recoding 'NA' to '70' to show that now colors in plots are correct
trust_eur_cyp$trust_ecb[is.na(trust_eur_cyp$trust_ecb)] <- 70

#Rerun plotly code above.`