Shapes in Chart.Combine (and similar) are not combined
Description
Shapes in Chart.Combine (and similar) are not combined.
Repro steps
Chart.SingleStack ([
    Chart.Line(Array.init 100 (fun i -> i, float i * 2.5))
    |> Chart.withY_AxisStyle ("",Zeroline = false)
    |> Chart.withShapes [Shape.init(ShapeType = StyleParam.ShapeType.Line, X0 = 10, Y0 = 0., X1 = 10, Y1 = 200.)]
    Chart.Line(Array.init 100 (fun i -> i, float i * 2.5))
    |> Chart.withY_AxisStyle ("",Zeroline = false)
    |> Chart.withShapes [Shape.init(ShapeType = StyleParam.ShapeType.Line, X0 = 35, Y0 = 0., X1 = 35, Y1 = 200.)]
    Chart.Line(Array.init 100 (fun i -> i, float i * 2.5))
    |> Chart.withShapes [Shape.init(ShapeType = StyleParam.ShapeType.Line, X0 = 41, Y0 = 0., X1 = 41, Y1 = 200.)]
    ] |> List.rev, true)
|> Chart.withLayoutGridStyle(
    RowOrder = StyleParam.LayoutGridRowOrder.BottomToTop
)
|> Chart.Show
Expected behavior
A stacked plot consisting of 3 line plots. Each line plot should have a black vertical line at the respective given X0/X1-Position, ranging from Y-Values (Y0/Y1) 0 to 200.
Actual behavior
Only the first plot (since List.rev it's on the bottom) has the black vertical line.
Known workarounds
Chart.SingleStack ([
    Chart.Line(Array.init 100 (fun i -> i, float i * 2.5))
    |> Chart.withY_AxisStyle ("",Zeroline = false)
    Chart.Line(Array.init 100 (fun i -> i, float i * 2.5))
    |> Chart.withY_AxisStyle ("",Zeroline = false)
    Chart.Line(Array.init 100 (fun i -> i, float i * 2.5))
    ] |> List.rev, true)
|> Chart.withLayoutGridStyle(
    RowOrder = StyleParam.LayoutGridRowOrder.BottomToTop
)
|> Chart.withShapes [
    Shape.init(ShapeType = StyleParam.ShapeType.Line, X0 = 10, Y0 = 0., X1 = 10, Y1 = 200., Yref = "y1")
    Shape.init(ShapeType = StyleParam.ShapeType.Line, X0 = 35, Y0 = 0., X1 = 35, Y1 = 200., Yref = "y2")
    Shape.init(ShapeType = StyleParam.ShapeType.Line, X0 = 41, Y0 = 0., X1 = 41, Y1 = 200., Yref = "y3")
]
|> Chart.Show
Related information
- Windows 10 Home 64-bit (10.0, Build 18362) (18362.19h1_release.190318-1202)
- fsharp.plotly.1.2.3-beta2
- .NET Version 3.1.101
This is fixed now for some properties that are collections (such as layout shapes, annotations, and images). I'll leave this open though as its is pointing to the correct upstream issue in DynamicObj that should be solved to offer a generic solution
When using Chart.Pie it is not working for me at the moment. I tried withShape, withShapes and to init a new Layout with -> withLayout. But all three options is not working:
let s1 =
  Shape.init (ShapeType.Rectangle, 2., 4., 3., 4., Opacity = 0.3, Fillcolor = Color.fromHex ("#d3d3d3"))

let gauge =
  Chart.Pie(
    values,
    Labels = labels,
    Rotation = -126.,
    Name = "Gauge",
    Hole = 0.75,
    Direction = Direction.Clockwise,
    Marker = Marker.init (Colors = colors, Outline = Line.init (Color = Color.fromHex ("#ffffff"), Width = 4.)),
    Sort = false,
    ShowLegend = false,
    TextInfo = TextInfo.None,
    TextPosition = TextPosition.Outside
  )
  |> Chart.withLayout (Layout.init (Shapes = [ s1 ], Width = 500, Height = 500))
  |> Chart.savePNG (Environment.CurrentDirectory + "/image", Width = 500, Height = 500)
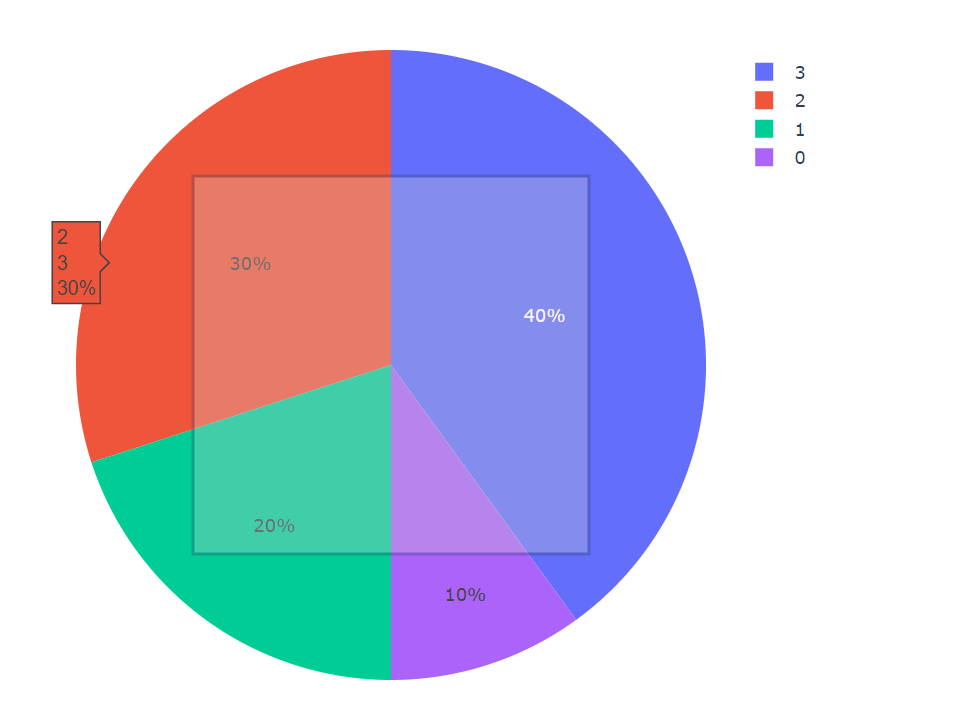
This should work if you set your X and Y values to relative positions:
#r "nuget: Plotly.NET, 2.0.0-preview.16"

open Plotly.NET
open Plotly.NET.LayoutObjects
Chart.Pie(
    [1;2;3;4]
)
|> Chart.withShape(
    Shape.init (StyleParam.ShapeType.Rectangle, 0.2, 0.8, 0.2, 0.8, Opacity = 0.3, Fillcolor = Color.fromHex ("#d3d3d3"))
)
|> Chart.show
This works but when using ShapeType SvgPath it doesn't show. I tried using the Path parameter to give my svg path but it doesn't work. I used the following path: 'M 0.3098217822166852 0.9078385041664925 L 0.4773423053240837 0.4894345434564825 L 0.5226576946759163 0.5105654565435175 M 0.5226576946759163,0.5105654565435175 C 0.528488928882922,0.49806033443148157 0.5230705786555534,0.4831735395310895 0.5105654565435175 0.4773423053240837 C 0.49806033443148157 0.47151107111707796 0.4831735395310895 0.4769294213444466 0.4773423053240837 0.4894345434564825 Z'
I used the same path with the Python version of this script and there it works. So I just need to find the difference.
Oke i got it fixed I saw that my path contained , instead of . So every float got wrongly converted to string hence it didnt work when drawing a path. It works now. I used string FLOAT NUMBER to convert float to string correctly
closing this as it is fixed for now using a hardcoded workaround, at least for combining collections on the layout