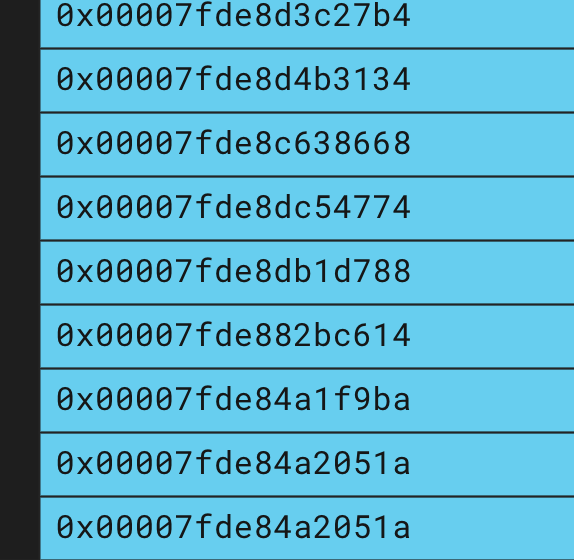
JAVA flamegraph contains mostly hexa-decimal values for the application code and no method names
I followed the tutorial.
Passed the
java -Dcom.sun.management.jmxremote=true -Dcom.sun.management.jmxremote.port=9999 -Dcom.sun.management.jmxremote.ssl=false -Dcom.sun.management.jmxremote.authenticate=false -XX:+PreserveFramePointer
Also while compiling used the
apply plugin: 'java-library' compileJava { options.debug = true options.debugOptions.debugLevel = "source,lines,vars" }
to enable java debug symbols.
Still getting the hexadecimal values instead of the method names.
Hi @c3-pranjaysagar ,
Could you provide some more details on your setup and how to reproduce the issue? Here are some things that might be helpful for us to debug:
- A container image and a yaml file to start the application on one of our own clusters.
- What java version does your application use?
- The
pem(for Pixie edge module) logs. - What environment are you using? e.g. GKE, AKS, EKS, minikube, or some other?
- Perhaps, capture a screen shot of the problem and attach it to a comment in this issue.
To get the pem logs, you will need the pod name for the pem. Do the following:
-
kubectl -n pl get pods -
kubectl -n pl logs vizier-pem-<XXXX>whereXXXXis substituted from the pod list in step (1) above.
Additionally you can try restarting the pem by running kubectl -n pl delete pod vizier-pem-<XXXX>. i.e. this might be useful to get a fresh set of logs. Also you can try running px update vizier to update the backend data collection compenents.
Thanks @etep for responding. I followed the steps from the tutorial. Regarding other info it is as follows.
java version - `openjdk version "17.0.2"
logs from pem pod
Defaulted container "pem" out of: pem, qb-wait (init) I20220915 17:12:51.431335 24028 env.cc:47] Started: /app/src/vizier/services/agent/pem/pem Started external stacktrace collection signal processor thread I20220915 17:12:51.431660 24028 pem_main.cc:93] Pixie PEM. Version: v0.11.8+Distribution.ec15091.202208022317.1.RELEASE.jenkins, id: d9606287-7004-4377-8788-81f105a9376f I20220915 17:12:51.431730 24028 stirling.cc:936] Creating Stirling, registered sources: [process_stats, network_stats, jvm_stats, socket_tracer, perf_profiler, proc_exit_tracer, stirling_error] I20220915 17:12:51.431742 24028 system_info.cc:41] Location of proc: /host/proc I20220915 17:12:51.431751 24028 system_info.cc:42] Location of sysfs: /sys/fs I20220915 17:12:51.431756 24028 system_info.cc:43] Number of CPUs: 64 I20220915 17:12:51.431829 24028 system_info.cc:34] /host/proc/version: Linux version 5.4.0-1089-azure (buildd@lcy02-amd64-011) (gcc version 7.5.0 (Ubuntu 7.5.0-3ubuntu1~18.04)) #94~18.04.1-Ubuntu SMP Fri Aug 5 12:34:50 UTC 2022 I20220915 17:12:51.431924 24028 system_info.cc:34] /host/etc/os-release: NAME="Ubuntu" VERSION="18.04.6 LTS (Bionic Beaver)" ID=ubuntu ID_LIKE=debian PRETTY_NAME="Ubuntu 18.04.6 LTS" VERSION_ID="18.04" HOME_URL="https://www.ubuntu.com/" SUPPORT_URL="https://help.ubuntu.com/" BUG_REPORT_URL="https://bugs.launchpad.net/ubuntu/" PRIVACY_POLICY_URL="https://www.ubuntu.com/legal/terms-and-policies/privacy-policy" VERSION_CODENAME=bionic UBUNTU_CODENAME=bionic I20220915 17:12:51.431942 24028 system_info.cc:34] /host/etc/lsb-release: DISTRIB_ID=Ubuntu DISTRIB_RELEASE=18.04 DISTRIB_CODENAME=bionic DISTRIB_DESCRIPTION="Ubuntu 18.04.6 LTS" I20220915 17:12:51.432008 24028 probe_cleaner.cc:102] Cleaning probes from /sys/kernel/debug/tracing/kprobe_events with the following marker: pixie I20220915 17:12:51.434031 24028 probe_cleaner.cc:117] All Stirling probes removed (count=0) I20220915 17:12:51.434046 24028 probe_cleaner.cc:102] Cleaning probes from /sys/kernel/debug/tracing/uprobe_events with the following marker: pixie I20220915 17:12:51.434060 24028 probe_cleaner.cc:117] All Stirling probes removed (count=0) I20220915 17:12:51.434067 24028 source_connector.cc:36] Initializing source connector: process_stats I20220915 17:12:51.434072 24028 stirling.cc:448] Adding info class: [process_stats/process_stats] I20220915 17:12:51.434079 24028 source_connector.cc:36] Initializing source connector: network_stats I20220915 17:12:51.434084 24028 stirling.cc:448] Adding info class: [network_stats/network_stats] I20220915 17:12:51.434089 24028 source_connector.cc:36] Initializing source connector: jvm_stats I20220915 17:12:51.434093 24028 stirling.cc:448] Adding info class: [jvm_stats/jvm_stats] I20220915 17:12:51.434229 24028 source_connector.cc:36] Initializing source connector: socket_tracer I20220915 17:12:51.434253 24028 linux_headers.cc:209] Found Linux kernel version using .note section. I20220915 17:12:51.434260 24028 linux_headers.cc:90] Obtained Linux version string from
uname: 5.4.0-1089-azure I20220915 17:12:51.434264 24028 linux_headers.cc:599] Detected kernel release (uname -r): 5.4.0-1089-azure I20220915 17:12:51.434376 24028 linux_headers.cc:438] Looking for host mounted headers at /host/lib/modules/5.4.0-1089-azure I20220915 17:12:51.434417 24028 linux_headers.cc:483] Linked linux headers found at /host/usr/src/linux-headers-5.4.0-1089-azure to symlink at /lib/modules/5.4.0-1089-azure/build I20220915 17:12:51.434432 24028 bcc_wrapper.cc:120] Using linux headers found at /lib/modules/5.4.0-1089-azure/build for BCC runtime. warning: ./src/stirling/source_connectors/socket_tracer/bcc_bpf/grpc_c_trace.c:652:3: loop not unrolled: the optimizer was unable to perform the requested transformation; the transformation might be disabled or specified as part of an unsupported transformation ordering I20220915 17:13:05.775723 24028 socket_trace_connector.cc:397] Number of kprobes deployed = 40 I20220915 17:13:05.775784 24028 socket_trace_connector.cc:398] Probes successfully deployed. I20220915 17:13:05.775838 24028 socket_trace_connector.cc:334] Initializing perf buffers with ncpus=64 and scaling_factor=0.125 I20220915 17:13:05.775867 24028 socket_trace_connector.cc:323] Total perf buffer usage for kData buffers across all cpus: 268006720 I20220915 17:13:05.775878 24028 socket_trace_connector.cc:323] Total perf buffer usage for kControl buffers across all cpus: 13345536 I20220915 17:13:05.775887 24028 bcc_wrapper.cc:345] Opening perf buffer: socket_data_events [requested_size=837521 num_pages=256 size=1048576] (per cpu) I20220915 17:13:05.827164 24028 bcc_wrapper.cc:345] Opening perf buffer: socket_control_events [requested_size=99297 num_pages=32 size=131072] (per cpu) I20220915 17:13:05.869657 24028 bcc_wrapper.cc:345] Opening perf buffer: conn_stats_events [requested_size=99297 num_pages=32 size=131072] (per cpu) I20220915 17:13:05.875774 24028 bcc_wrapper.cc:345] Opening perf buffer: mmap_events [requested_size=9930 num_pages=4 size=16384] (per cpu) I20220915 17:13:05.878541 24028 bcc_wrapper.cc:345] Opening perf buffer: go_grpc_events [requested_size=837521 num_pages=256 size=1048576] (per cpu) I20220915 17:13:05.902662 24028 bcc_wrapper.cc:345] Opening perf buffer: grpc_c_events [requested_size=837521 num_pages=256 size=1048576] (per cpu) I20220915 17:13:05.938894 24028 bcc_wrapper.cc:345] Opening perf buffer: grpc_c_header_events [requested_size=837521 num_pages=256 size=1048576] (per cpu) I20220915 17:13:05.963389 24028 bcc_wrapper.cc:345] Opening perf buffer: grpc_c_close_events [requested_size=837521 num_pages=256 size=1048576] (per cpu) I20220915 17:13:05.987610 24028 socket_trace_connector.cc:402] Number of perf buffers opened = 8 I20220915 17:13:06.013605 24028 stirling.cc:448] Adding info class: [socket_tracer/conn_stats] I20220915 17:13:06.013648 24028 stirling.cc:448] Adding info class: [socket_tracer/http_events] I20220915 17:13:06.013659 24028 stirling.cc:448] Adding info class: [socket_tracer/mysql_events] I20220915 17:13:06.013664 24028 stirling.cc:448] Adding info class: [socket_tracer/cql_events] I20220915 17:13:06.013669 24028 stirling.cc:448] Adding info class: [socket_tracer/pgsql_events] I20220915 17:13:06.013674 24028 stirling.cc:448] Adding info class: [socket_tracer/dns_events] I20220915 17:13:06.013680 24028 stirling.cc:448] Adding info class: [socket_tracer/redis_events] I20220915 17:13:06.013685 24028 stirling.cc:448] Adding info class: [socket_tracer/nats_events.beta] I20220915 17:13:06.013690 24028 stirling.cc:448] Adding info class: [socket_tracer/kafka_events.beta] I20220915 17:13:06.013695 24028 stirling.cc:448] Adding info class: [socket_tracer/mux_events] I20220915 17:13:06.013758 24028 source_connector.cc:36] Initializing source connector: perf_profiler I20220915 17:13:06.013828 24028 linux_headers.cc:90] Obtained Linux version string fromuname: 5.4.0-1089-azure I20220915 17:13:06.013840 24028 linux_headers.cc:599] Detected kernel release (uname -r): 5.4.0-1089-azure I20220915 17:13:06.013904 24028 bcc_wrapper.cc:120] Using linux headers found at /lib/modules/5.4.0-1089-azure/build for BCC runtime. I20220915 17:13:08.058634 24028 bcc_wrapper.cc:345] Opening perf buffer: histogram_a [requested_size=117828 num_pages=32 size=131072] (per cpu) I20220915 17:13:08.064561 24028 bcc_wrapper.cc:345] Opening perf buffer: histogram_b [requested_size=117828 num_pages=32 size=131072] (per cpu) I20220915 17:13:08.070118 24028 perf_profile_connector.cc:145] PerfProfiler: Stack trace profiling sampling probe successfully deployed. I20220915 17:13:08.070143 24028 perf_profile_connector.cc:164] PerfProfiler: Java symbolization disabled. I20220915 17:13:08.070152 24028 stirling.cc:448] Adding info class: [perf_profiler/stack_traces.beta] I20220915 17:13:08.070219 24028 source_connector.cc:36] Initializing source connector: proc_exit_tracer I20220915 17:13:08.070264 24028 linux_headers.cc:90] Obtained Linux version string fromuname: 5.4.0-1089-azure I20220915 17:13:08.070284 24028 linux_headers.cc:599] Detected kernel release (uname -r): 5.4.0-1089-azure I20220915 17:13:08.070318 24028 bcc_wrapper.cc:120] Using linux headers found at /lib/modules/5.4.0-1089-azure/build for BCC runtime. I20220915 17:13:08.648311 24028 bcc_wrapper.cc:345] Opening perf buffer: proc_exit_events [requested_size=5242880 num_pages=2048 size=8388608] (per cpu) I20220915 17:13:08.806587 24028 stirling.cc:448] Adding info class: [proc_exit_tracer/proc_exit_events] I20220915 17:13:08.806668 24028 source_connector.cc:36] Initializing source connector: stirling_error I20220915 17:13:08.806746 24028 stirling.cc:448] Adding info class: [stirling_error/stirling_error] I20220915 17:13:08.806753 24028 stirling.cc:448] Adding info class: [stirling_error/probe_status] I20220915 17:13:08.806761 24028 stirling.cc:414] Stirling successfully initialized. I20220915 17:13:08.810995 24028 manager.cc:156] Hostname: aks-userpool-32233912-vmss000004 I20220915 17:13:50.471426 24028 cgroup_path_resolver.cc:127] Auto-discovered CGroup base path: /sys/fs/cgroup/cpu,cpuacct I20220915 17:13:50.475731 24028 cgroup_path_resolver.cc:130] Auto-discovered example path: /sys/fs/cgroup/cpu,cpuacct/kubepods/burstable/pod1defef61-23b8-4f28-9efd-f676a2fee20b/5873756f1f9d65f6e4ee851807660506dd53b0f2a582e06b4e7be10c49646533/cgroup.procs I20220915 17:13:50.476092 24028 cgroup_path_resolver.cc:134] Auto-discovered template: /sys/fs/cgroup/cpu,cpuacct/kubepods/$2/pod$0/$1/cgroup.procs I20220915 17:13:50.476101 24028 cgroup_metadata_reader.cc:41] Using path_resolver with configuration: template=/sys/fs/cgroup/cpu,cpuacct/kubepods/$2/pod$0/$1/cgroup.procs pod_id_separators=- qos_spearator=/ I20220915 17:13:50.505900 26511 stirling.cc:816] Stirling is running. I20220915 17:13:50.562220 26511 perf_profile_connector.cc:381] PerfProfileConnector statistics: kBPFMapSwitchoverEvent=1 kCumulativeSumOfAllStackTraces=209664 kLossHistoEvent=0 I20220915 17:13:50.562278 26511 perf_profile_connector.cc:395] PerfProfileConnector u_symbolizer num_symbols_cached=0 hits=0 accesses=0 hit_rate=0 I20220915 17:13:50.562291 26511 perf_profile_connector.cc:398] PerfProfileConnector k_symbolizer num_symbols_cached=0 hits=0 accesses=0 hit_rate=0 I20220915 17:13:50.567087 24028 heartbeat.cc:140] Heartbeat ACK latency moving average: 3 ms I20220915 17:13:55.478927 24028 metadata_state.h:111] Service CIDR updated to 10.0.0.0/16 I20220915 17:13:55.640930 26822 uprobe_symaddrs.cc:855] Getting symbol offsets for version: major=16 minor=13 patch=0 I20220915 17:13:59.170053 26822 uprobe_manager.cc:739] Number of uprobes deployed = 304
Environment - currently Azure
Screenshot of env variable in pem-vizer-XXXX pod manifest

The env. var. PL_PROFILER_JAVA_SYMBOLS needs to be set to true. There is a related question though: why is your env. var. set to false. We are looking at the version info right now. (stay tuned).
@etep based on online search and going through the code I also realized same that it should be true, I'm not sure why or how it is getting set to false.
Although I tried manually editing the daemon set to true and relaunching our application pod as well. I believe there is some extra information now as I see less hexadecimal values on stacks. But there is also now a big chunk of stack that says 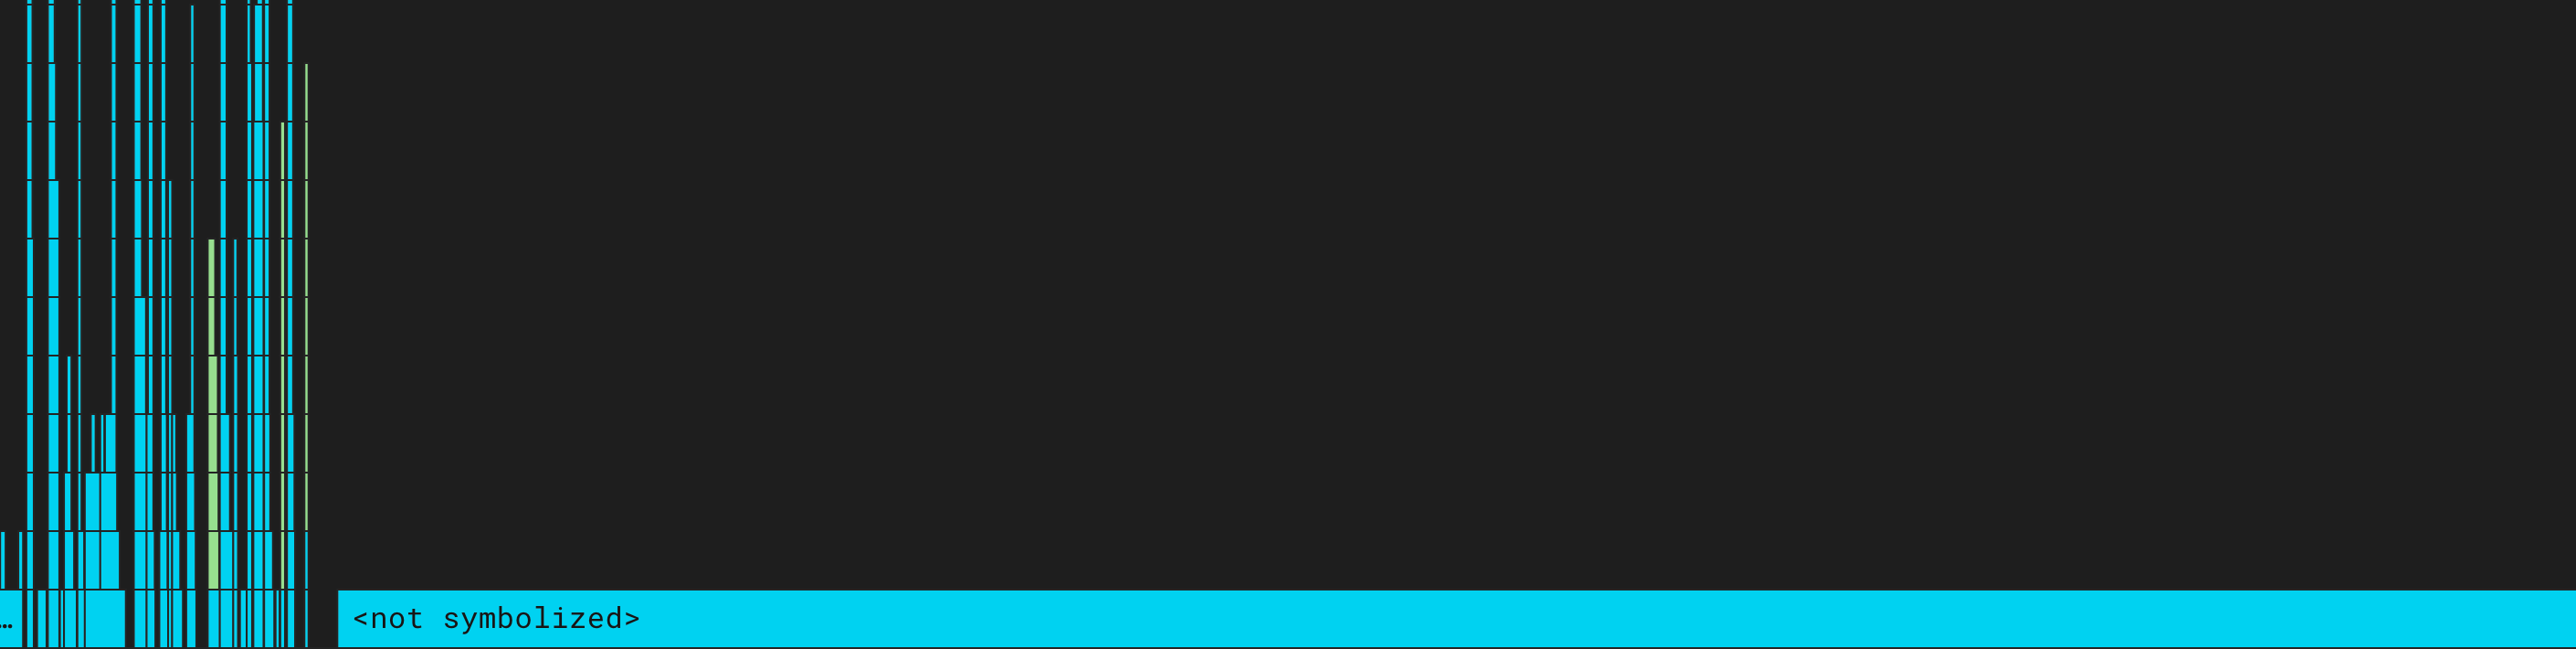
@etep Update after manually editing the daemon set to true and relaunching our application pod as well. The hexa decimal issue were gone after waiting for like 2-3 minutes, and same for the
But, the stack is not complete. As, not all the methods that are called iteratively are present on the stacks in the flamegraph. Is it a known issue? And is anything else needs to be done on the application side, while building or running the code base?
Hi @c3-pranjaysagar ,
Good to know that you found a work around. I am currently investigating the theory that there is some override for the default value of the Java profiling env. var. that is handled incorrectly for self hosted. We should keep this issue open while we verify the issue and resolve it (or iterate to a new theory of what is going wrong).
It seems like you have a new issue regarding the actual profiling results? If so, could you file that issue, along with some screen shots and any more information that might help us reproduce?
Your Java version is reasonably up-to-date, so I'm not suspecting a problem with frame pointers. Java can optimize code, so if there are some functions that are inlined, then they will not be in the flamegraphs. We saw this optimization issue with our toy test applications: essentially, we needed to craft some known stack trace but in a way that would not get optimized away.
@etep thanks for the help, I'll file a new issue for the incomplete profiling result. Although I'm not sure as to what screenshot I could provide for the methods that are not showing on the flamegraph.
Although I'll try to share as much info as I could.
I have 1 more issue related to deployment, Already created an issue for that https://github.com/pixie-io/pixie/issues/594#issue-1374962388
We saw #594 also. Thank you for filing the separate issue. For the profiler, there are some knobs we can tune to see if the stack traces you observe better match your prior expectations. (I will write more about it on the new issue).
The issue here is that default value of the flag is incorrect. In addition we need to update the release checklist to include java profiler.
@aimichelle, can you patch the flag and update the release checklist when you get a chance.