Pressing run executes old pixie script instead of the edited version
Describe the bug After running my script in scratch pad for debugging, I wanted to run the sample bpftrace script just as a sanity check.
On doing so, the dialogue box suspiciously gave me the same probe name I had used for the previous script, and I can confirm that it doesn't run the updated code.
I tried reloading the page and running the sample script several times, but to no avail. Closing and reopening the browser seemed to sometimes fix the issue though.
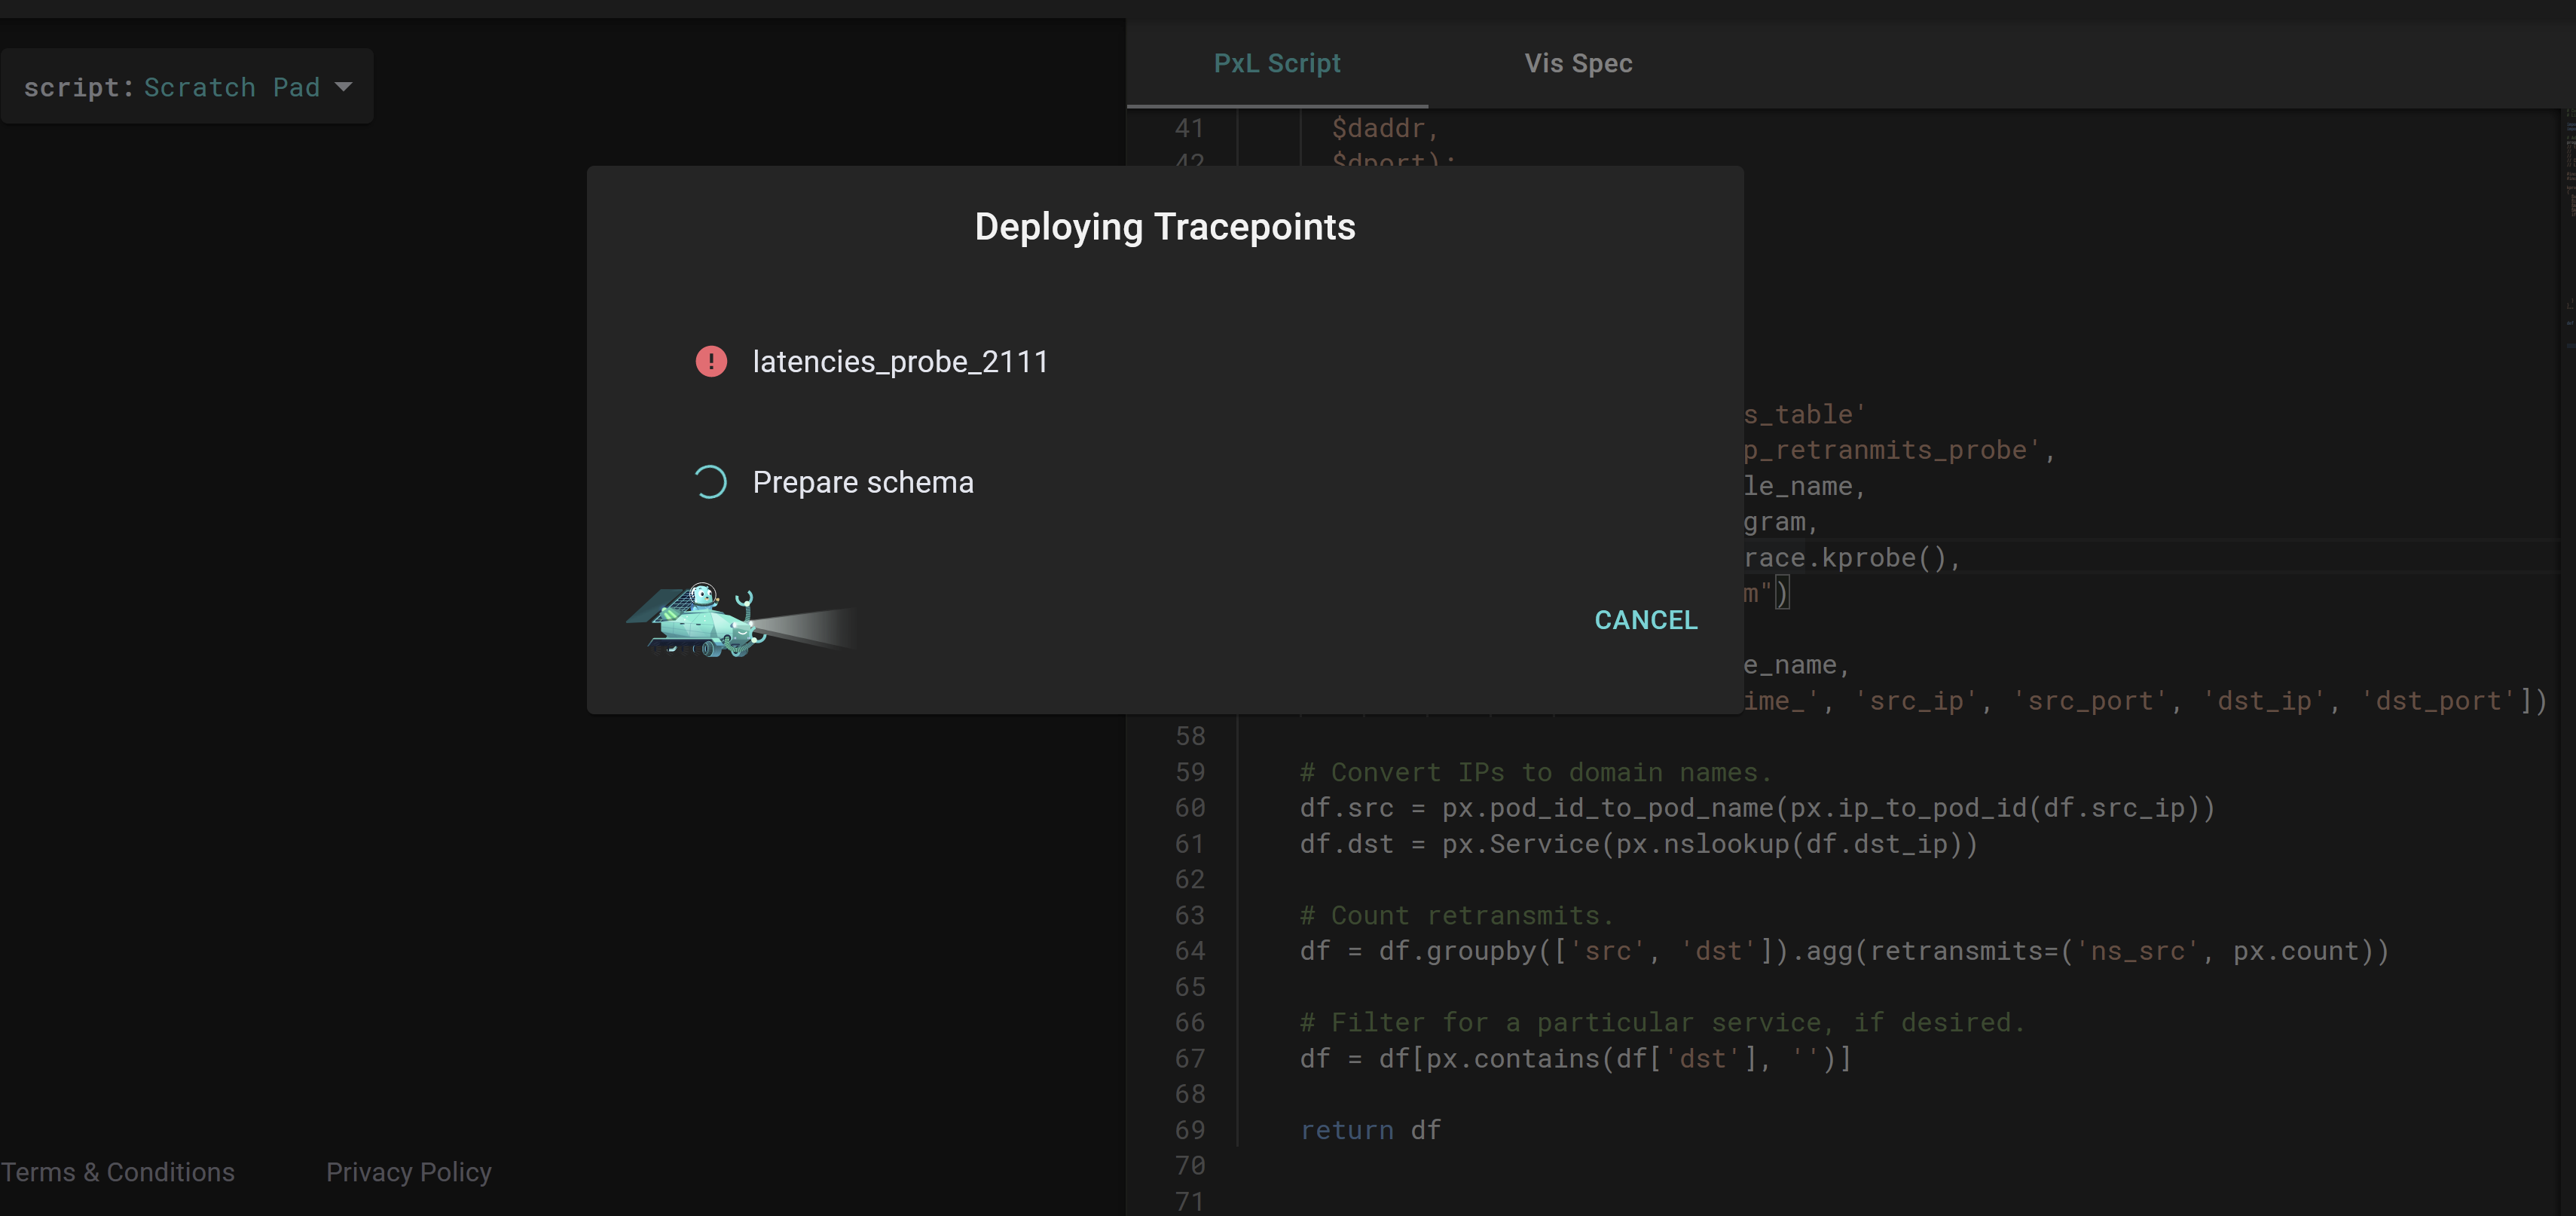
The below image shows the old probe name of my script showing up in the dialogue box, with the sample bpftrace code in the editor (not sure how much the attached image helps xD)
Expected behavior The updated code is run each time
Screenshots
@pranav-bhatt, are you trying before or after this commit from the 15th? I'm not sure whether this is the same issue or not, but I'd like to rule that out first.
If you still see the issue after that commit, could you confirm whether the steps here trigger what you saw?
- Install or update self-hosted Pixie.
- Select
px/tcp_retransmitsfrom the web UI using the script dropdown on the left. - Run the script (Ctrl/Cmd+Enter or click the Run button). It should deploy a tracepoint called
tcp_retransmit_tracer. - Open the editor (Ctrl/Cmd+E or click the edit icon near the Run button). On line 94, change
px.UpsertTracepoint('tcp_retransmit_tracer', ...)topx.UpsertTracepoint('latencies_probe_2111', ...). - Press Run (or Ctrl/Cmd+Enter) again, without closing the editor.
- The "Deploying Tracepoints" dialog updates correctly the first time, showing
latencies_probe_2111. - Edit the script again, changing the tracepoint name to
tcp_retransmits_probethis time. - Run it again.
- Your second set of edits is ignored, and it runs with the tracepoint
latencies_probe_2111again rather thantcp_retransmits_probe.
If that doesn't trigger the issue, could you elaborate a bit on the steps you took that did?
Unfortunately we aren't really in a position to deploy pixie cloud due to resource limitations on our end. However, I can confirm that this issue is the exact same one stated in the Known issues section on the "Dynamic Go Logging" doc page. Really sorry I couldn't do more :(
Thanks @pranav-bhatt , looks like there are a few bugs here:
- The bug which @NickLanam fixed, unrelated to the bug you mentioned above.
- The bug mentioned in the Known issues for "Dynamic Go Logging", which currently requires you to change the probe name when deploying a modified probe.
- The bug which results from the workaround for (2), where the updated script does not get run.
2 will require some more extensive changes to the backend, so will take us more time, so we'll focus on getting 3 fixed first. Thanks for your patience @pranav-bhatt!
cc: @NickLanam