recording increase memory usage but not release in time
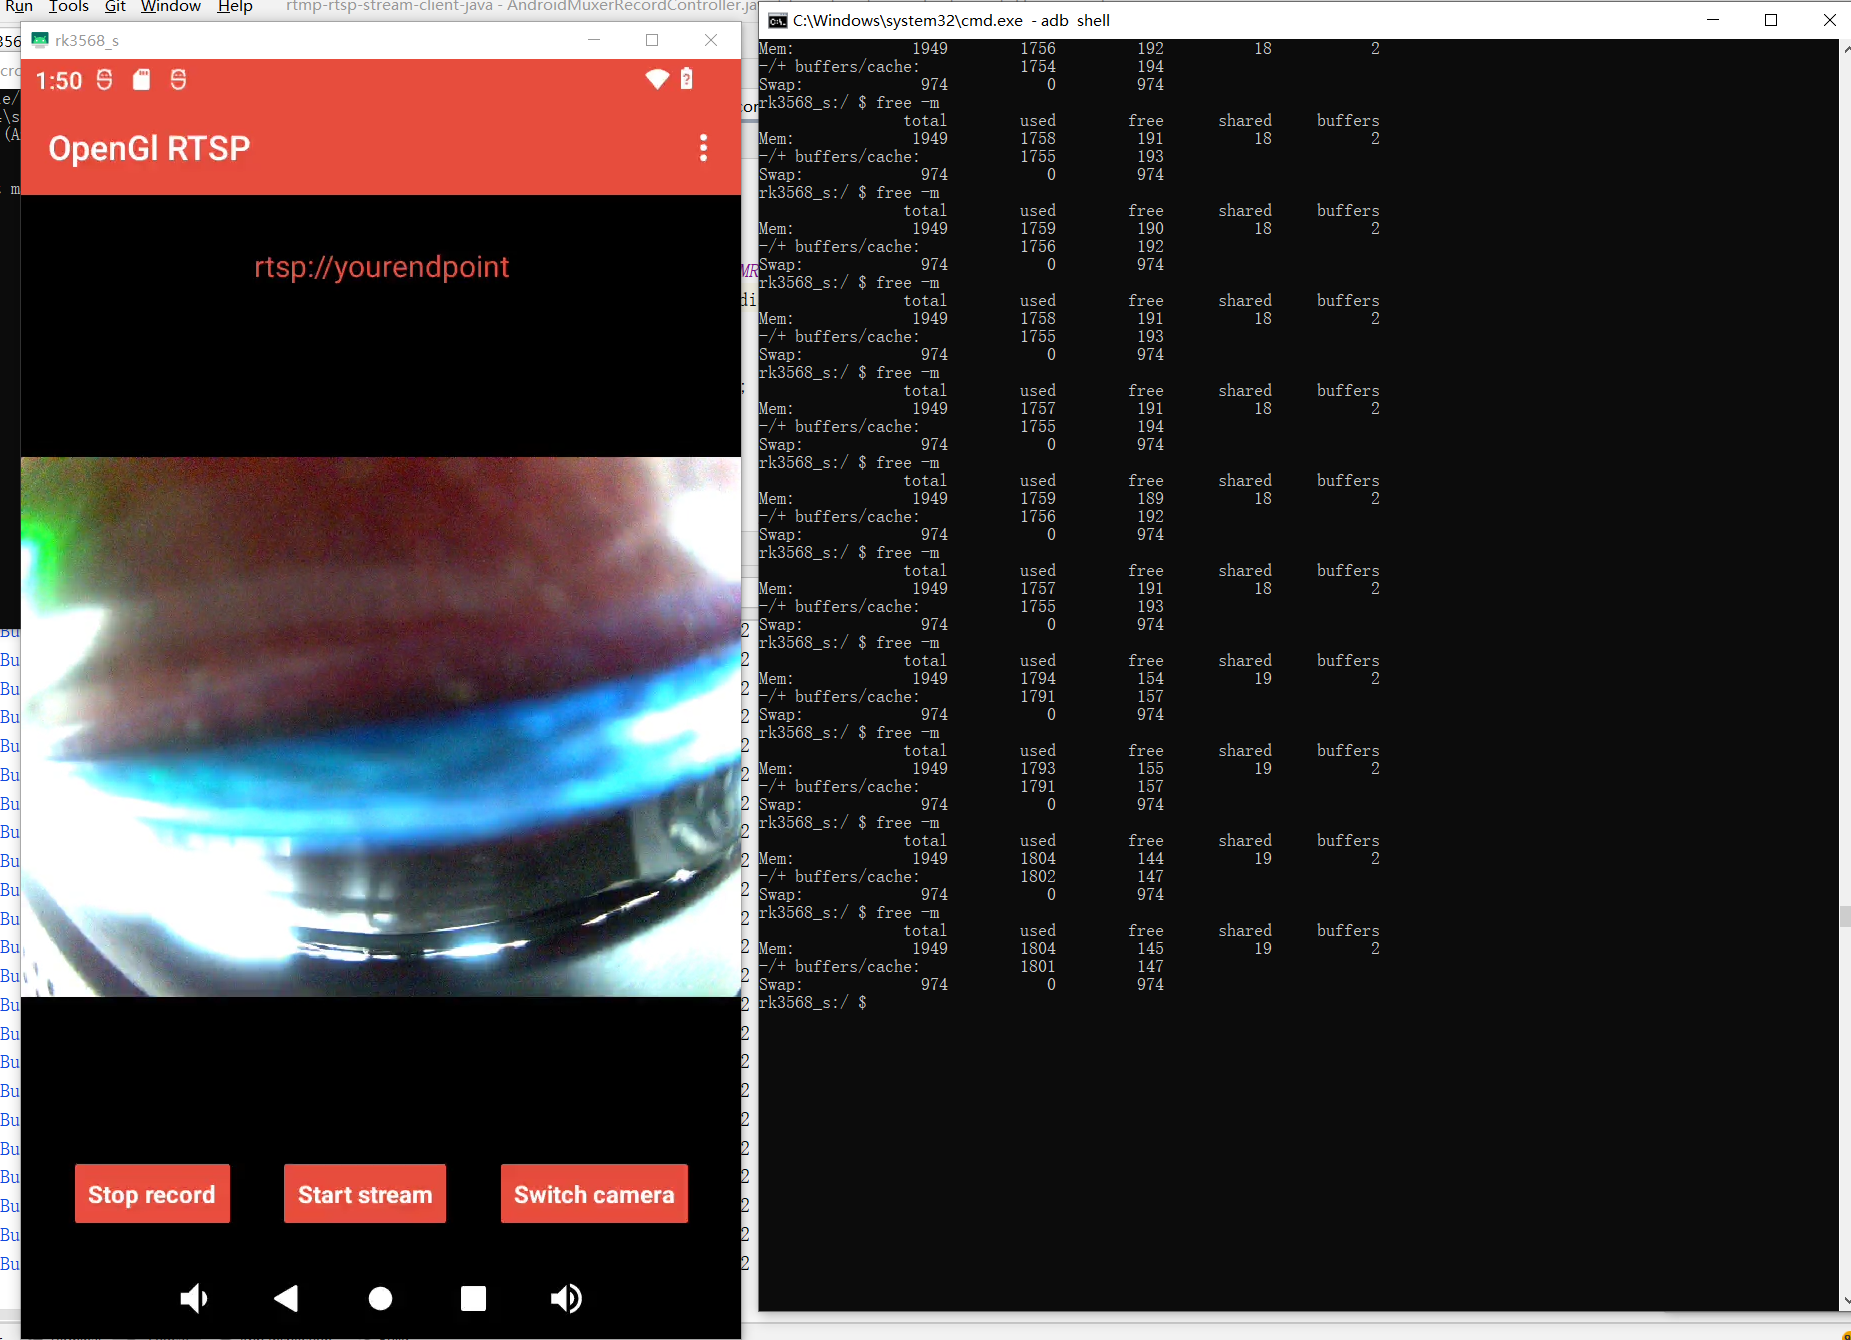
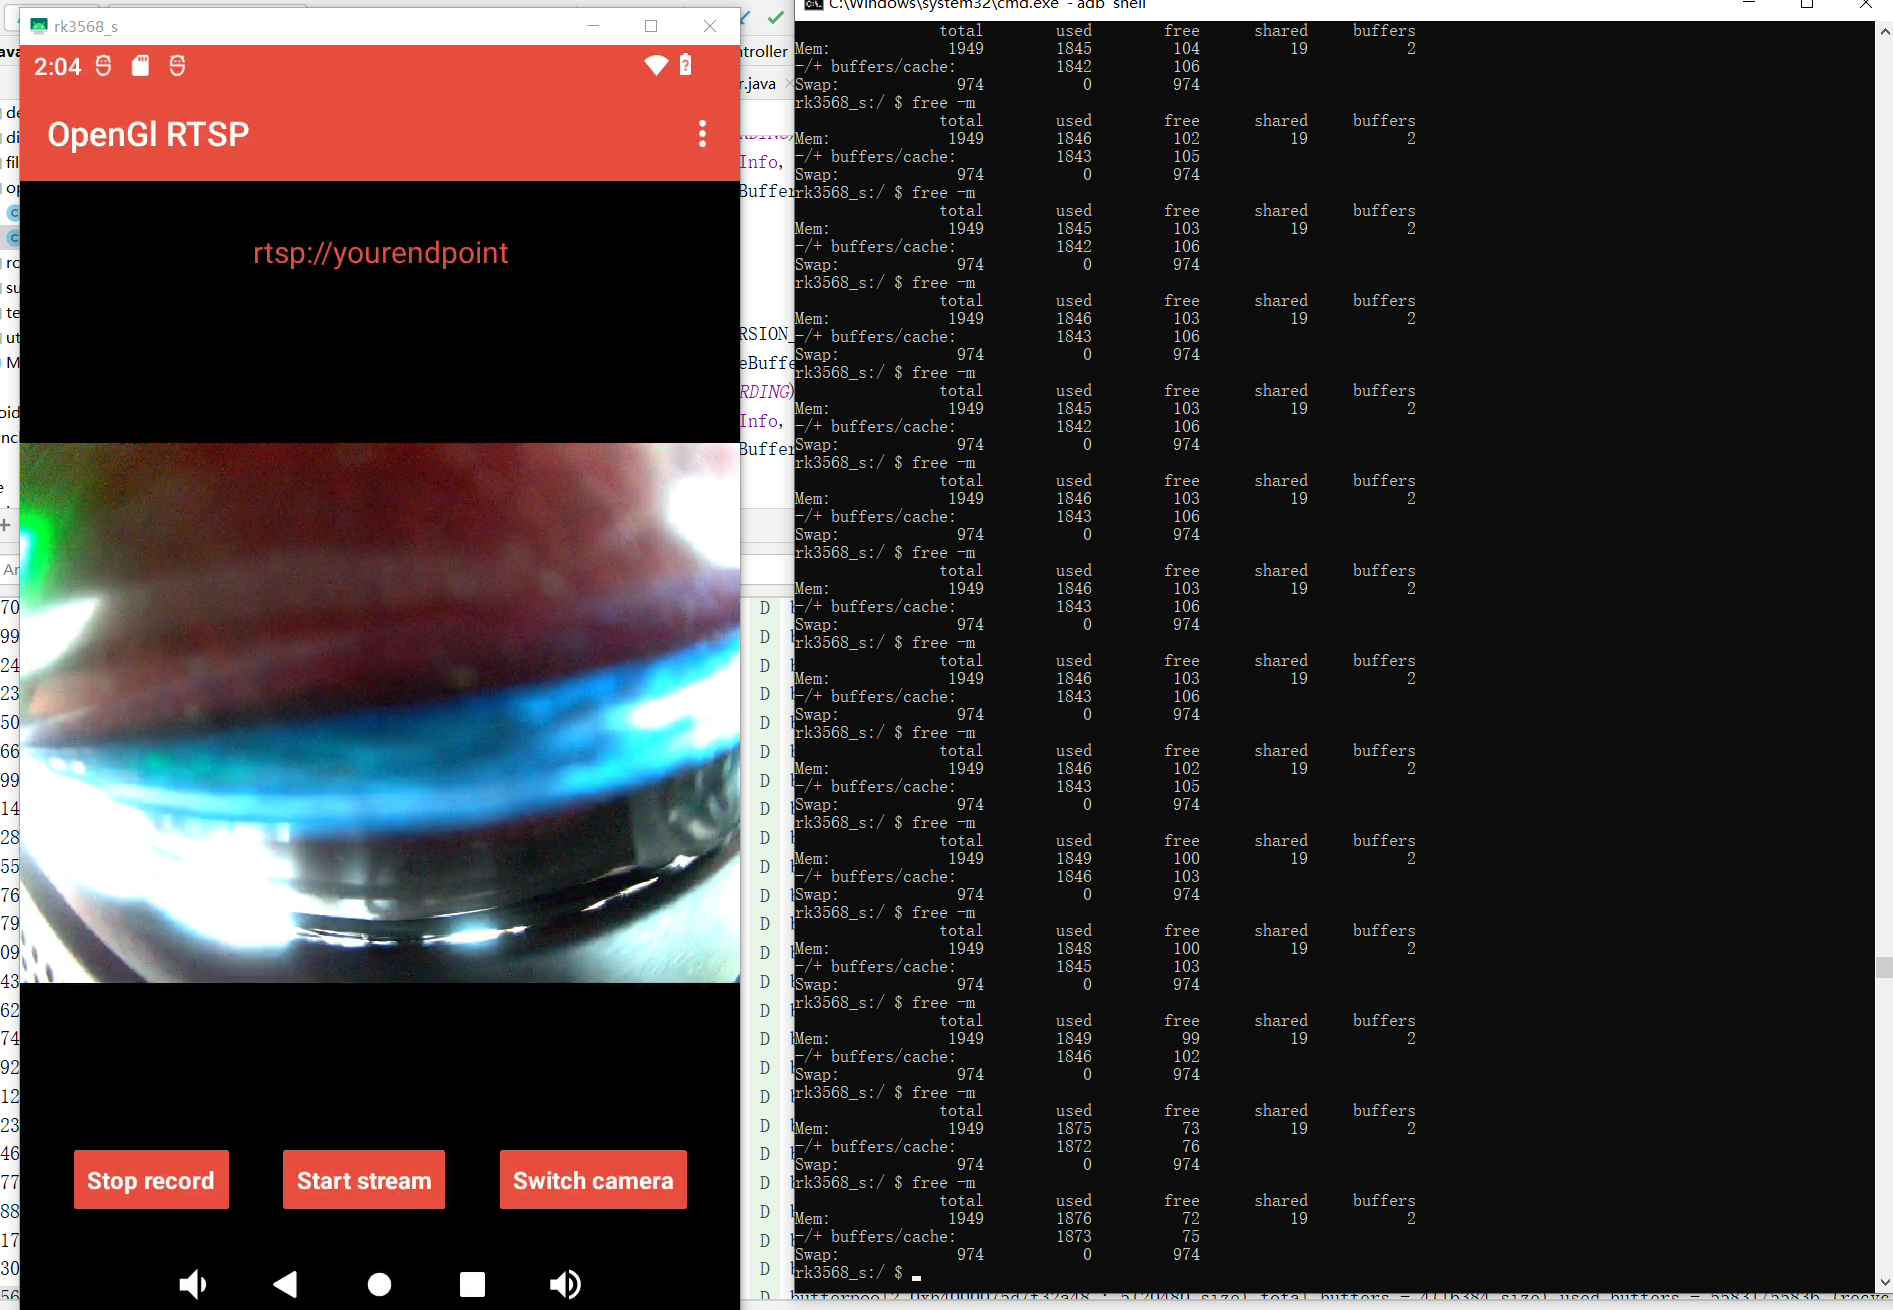
I just use your code and your example. Click OpenGl Rtsp and "start record" button. Use adb command "adb shell" and then "free -m" every few minutes to check the free memory. The logcat shows
BufferPoolAccessor2.0 com.pedro.rtpstreamer D bufferpool2 0xb4000075d7f32a48 : 5(20480 size) total buffers - 4(16384 size) used buffers - 68387/68392 (recycle/alloc) - 100/136775 (fetch/transfer)
Any idea to release memory in time or manually to do it better?
.
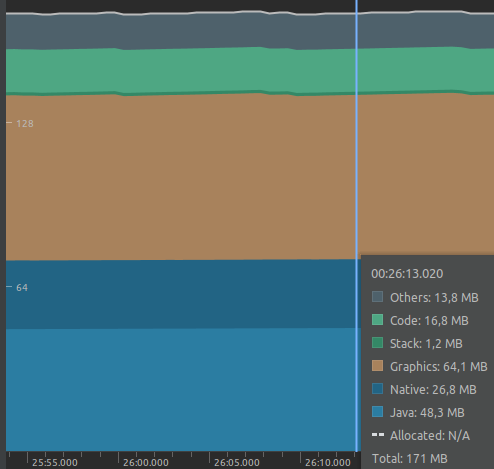
After recording for hours, the device's memory was down to 20M even less. It would cause a lot of problems because no memory to do other things.
Hello,
Are you using library without odifications? Can you reproduce the case only for rtsp or you can reproduce it using rtmp?
No any odifications. Only use the recording feature under OpenGl Rtsp. You can try by my step with the demo code. The code I used was download by "git clone https://github.com/pedroSG94/rtmp-rtsp-stream-client-java" about last week.
Can you tell me more or less a time when you can notice that memory increase? About 30min es enought to test and check differences? If you are only streaming, Do you get that memory problems or it is only for recording case? Meanwhile try using rtmp to discard rtsp module of this case
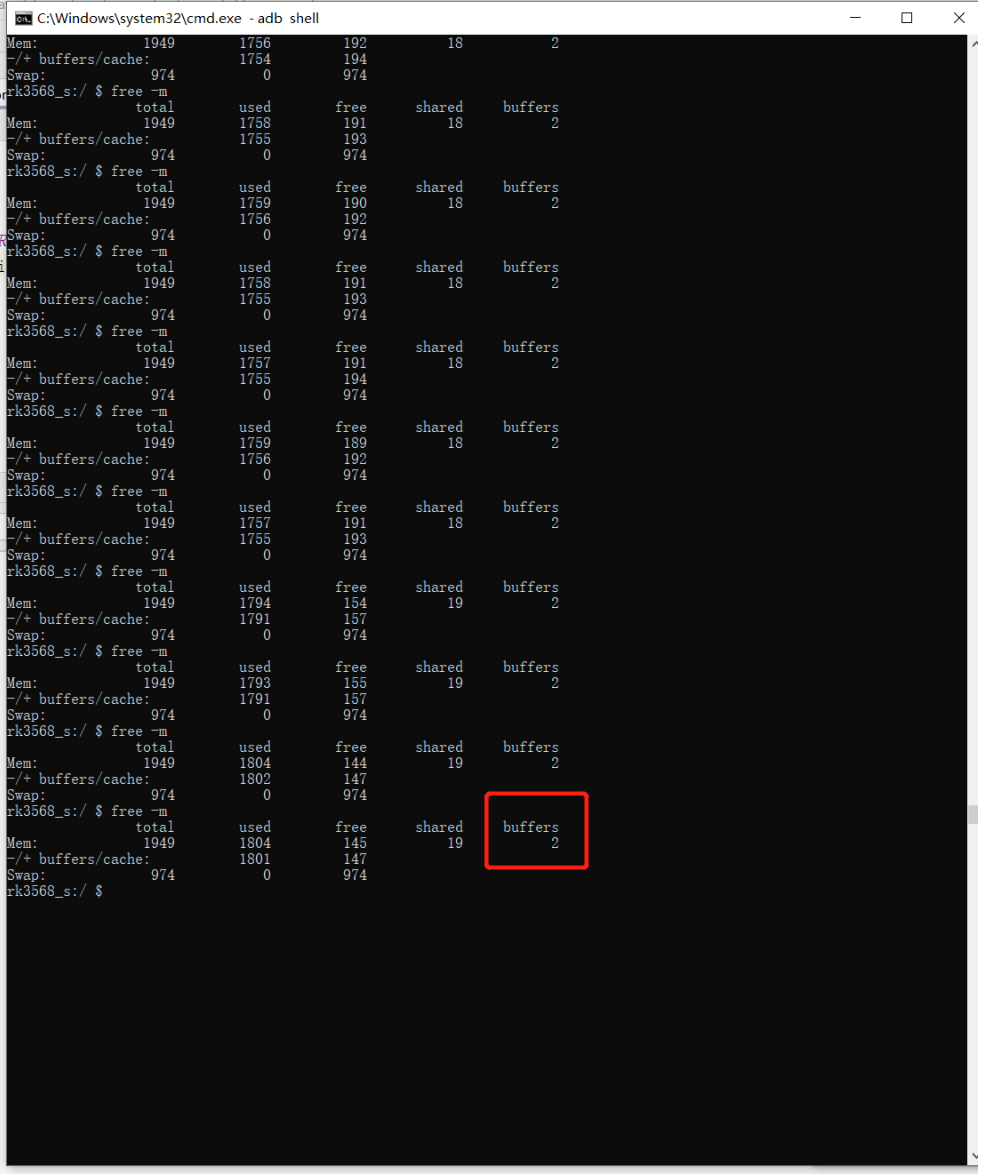
Every 1 minute or 2 minute can see the changes of free memory. I did't start rtmp or rtsp streaming, just start the record button and keep it recording for minutes. It's easy to find the memory changed, don't need to test a lot. About half an hour, the free memory was down from 200M to 50M.
Even I stop the application and restart the application, the memory was not recycled. But only I shutdown the device and restrat the device, the memory comes back. So I think is some native recources not be release,need your help for my poor in native code.
Hello,
I'm not using native code. All the code use Android java SDK. Anyway, I will check it and let you know results
What I know is that the buffers in native maybe not cleard and recycled, because after I stop the application, the buffers count in below is not decrease.
 .
.
Hi, brother. Any idea? I think this is a big issue of this lib, it makes me confused a lot.
Hello,
I was doing tests but I can find the reason. For now I'm testing using this: https://square.github.io/leakcanary
I had done this test with leakcanary yet, it does'nt work for this case. Leakcanary is good at java code like ui and variable but can't monitor the navite memory like linux buffers. Just connect your phone using USB and open develop mode, then use adb command to find out the problem. I found some code like ByteBuffer and BufferQueue in your job, maybe we need to release them in time.
Can you check "ByteBuffer.allocateDirect" in your code? what I know is this method will keep memory in native but not in jvm, so it would be hard to release. I search this words in the code, every filter and render use this function, maybe it's the reason. ByteBuffer.allocate() and ByteBuffer.allocateDirect() is different, how about use ByteBuffer.allocate() to replace ByteBuffer.allocateDirect()?
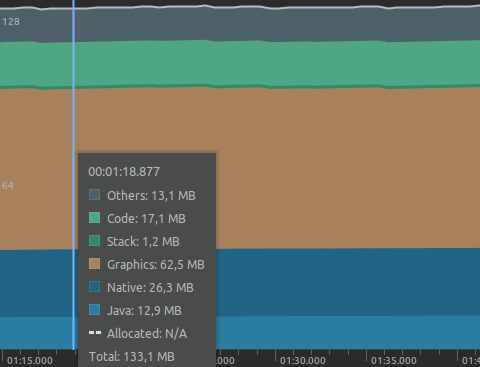
Can you check "ByteBuffer.allocateDirect" in your code? what I know is this method will keep memory in native but not in jvm, so it would be hard to release. I search this words in the code, every filter and render use this function, maybe it's the reason. ByteBuffer.allocate() and ByteBuffer.allocateDirect() is different, how about use ByteBuffer.allocate() to replace ByteBuffer.allocateDirect()?
I can't do it because opengl need an allocateDirect. Anyway, this can't be the problem because it is called only a time when you init filter in each filter and I can see the problem without filters.
I will mark this as help wanted for now and try to fix the problem. If you find the way to solve this problem any PR will be welcome.