Projection plots
So, this lets users define a new type of plot that I am nominally calling a projection plot (open to rename it). It loops over pixels from a camera location to a point specified in the model. A reasonable field of view is set by default. When doing the loop over pixels, it's conceptually easy to draw a wireframe since you just check if the stack of intersected cells differs from one pixel to the next.
TODO
- [x] Hook up python API to generate XML
- [x] Add documentation
- [x] Add orthographic projection (as opposed to perspective)
- [x] Parallelize with OpenMP
- [x] Up direction is currently only +z. Should be arbitrary.
- [x] Should read user-given plot names
- [x] Improve wireframe generation. Is currently patchy
Example from newly included regression tests:
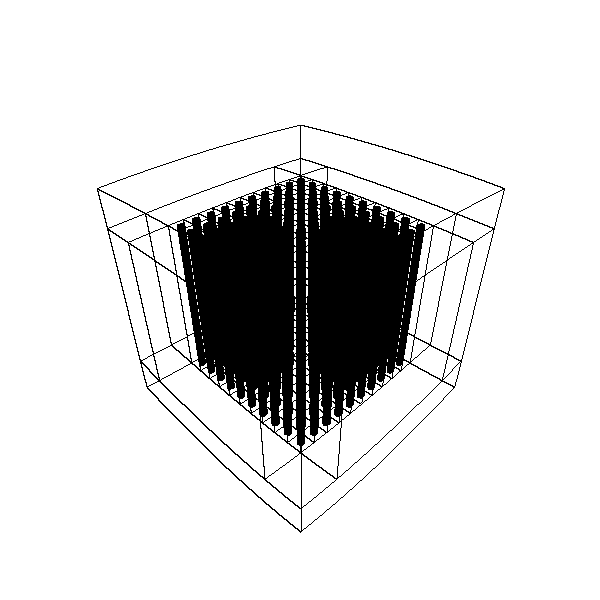
BEAVRS wireframe drawing. It gets a bit dense. Probably need some way to turn off the generation of lines in certain universes.
A really nice addon for this, would be to colour by the thickness of (non-vacuum) i.e. the total distance travelled by rays, useful for looking at shielding weak spots
@makeclean Through any non-vacuum material? It would be easy to do in principle. In fact, trivial, since this records the stack of material IDs getting passed through as the ray moves, then colors in reverse.
Do you think it would be better to color based on thickness through a material or cell of given ID?
The only tricky thing would be that we'd have to define a color map, which is plenty of extra coding and hardcoding (e.g. adding viridis coloring).
The projection is looking a lot better now. There are two modes:
Perspective:
Orthographic:
OK, so, it was a little tough to get this parallelized cleanly. There are two reasons why naive omp parallel for doesn't work here.
- omp parallel for, if applied to the vertical pixel coordinate loop, breaks the image into n short, long rectangles. On my 12 thread computer, the top rectangle takes about 1/4 as long to draw as the middle rectangles for BEAVRS. Most other problems would look like this: there is more complexity to the geometry in the middle of the image and vacuum surrounding it. So the default parallelization is naturally unbalanced and thus scales poorly.
- Drawing the wireframe requires inter-thread communication in some way, since we have to compare pixel's intersected stack of cell/surface IDs both horizontally and vertically. The standard omp parallel for would require some wacky caching of these intersection stacks to get the same results as the single thread version. So if you tried to mitigate (1) using omp dynamic scheduling, it would get even harder to cache these stack values to compare against later.
Say n is the number of threads. To solve both of the above, have thread 0 handles lines 0, n, 2n etc. Thread 1 gets lines 1, n+1, 2n+1, etc. After each thread finished rendering a line, you have it compare the cell/surface intersection stack with its upward neighbor. For thread 0, this comparison comes from the last result that thread n-1 obtained. For all others, thread i compares against thread i-1. To do these comparisons correctly, thread barriers have to be used.
This does give reproducibility against single-thread results, and seems to give 75-80% parallel efficiency on drawing BEAVRS for a 200x200 image. I'm a little novice on the OMP stuff so maybe there are some inefficiencies sticking out like a sore thumb. For instance there is definitely a little false sharing on the variable this_line_segments, but I think the cost of that is probably negligible compared to the ray tracing work each thread has to do.
I'm really itching to try this out and look it over, but I'll wait until you give us the heads up that it's ready. Until then I'll mark it as a draft so you don't get any review comments from others while you're tidying up.
OK, so, I've got it set up where you can wireframe only select material IDs now. From the hex lattice example:
r = 5
import numpy as np
for i in range(100):
    phi = 2 * np.pi * i/100
    thisp = openmc.ProjectionPlot(plot_id = 4 + i)
    thisp.filename = 'frame%s'%(str(i).zfill(3))
    thisp.look_at = [0, 0, 0]
    thisp.camera_position = [r * np.cos(phi), r * np.sin(phi), 6 * np.sin(phi)]
    thisp.pixels = [600, 600]
    thisp.color_by = 'material'
    thisp.colorize(geometry)
    thisp.set_transparent(geometry)
    thisp.xs[fuel] = 1.0
    thisp.xs[iron] = 1.0
    thisp.wireframe_regions = [fuel]

    plot_file.append(thisp)

plot_file.export_to_xml()
then
convert frame* hexlat.gif
gives
@pshriwise We are now good to go on a review! Phew... there are so many little details here to fill out. The only thing that's missing, I think, is starting ray tracing in universes below the root universe. I have neither tested nor implemented that, and would like to save that for some other PR when it becomes necessary. I'll let you test with DAGMC and test if it blows up.... because it uses the generic ray tracing routines in OpenMC, I hope it will work out of the box.
I also think the documentation could be improved a little bit, but am unsure how. I'm very open to rewording suggestions here.
As one more note, I think perhaps the camera polar angle values for each of the pixels should maybe not be uniformly spaced but rather be spaced according to cos(mu) or something. I would need to look at some computer graphics code to figure out how people conventionally set up the rays. Right now, it just creates uniform spacing in mu and phi over the camera's field of view.
NOTE: I have played with this some, and it doesn't make any difference at all. If you assume the screen is a plane oriented in the solid angle slice viewed by the camera, and the pixels are uniformly spaced on that plane, you find that mu_i = atan(x_i * tan(f/2)) where f is the vertical field of view and x_i are uniformly spaced pixel coordinates ranging from -1 to 1. It is similar for the camera phi coordinate. There is practically no difference in the resulting image, as far as I can tell, since a straight line approximates the function atan(x tan(f/2)) very well for reasonable field-of-view values.
OK... and there is redundant code in the regression test I added. I wish I could import what's in regression_tests/plot, but pytest doesn't like to import from relative directories, it seems. I guess we'd have to move that code into some common file that they both import, but am unsure where to put that. It's the code that does a hash-based comparison on a list of png files.
Alright, I had to resolve a merge conflict related to testing the recent to/from XML functionality that was added to the Plot class by Paul. I'll have to add corresponding to_xml/from_xml methods to the projection plots at this point, if the tests fail.
@pshriwise just getting on this again. The latest commit might get tests passing again. I'm hoping to test this a bit more extensively before merging. In particular, I'm hoping to get this integrated with openmc-dev/plotter, somehow.
@gridley looks like it did indeed fix it. Nice. Excited that this could make it into the plotter!
Thanks @pshriwise. After looking at what would have to go in to get this working in the plotter, it would be maybe a bit too much work for a side project. My general idea was to display a pixmap rendered by OpenMC after image generation, and for navigating the model, we'd use an OpenGL window with points laid down in 3D that are where the wireframe was last drawn by OpenMC, which would be pretty easy to cache and make accessible in the C API. This way, there would be responsive rotation and panning on a low-quality model, then a user would tap "r" or something like that to redraw the good-looking version of the model.
As a result, I think this is ready for review now. Should I test it with DagMC stuff before we begin, though?
@pshriwise is there any desire to get this merged from ANL? If not, I totally get it. Otherwise, if there's anything else I can do to move this along, please let me know.
@pshriwise is there any desire to get this merged from ANL? If not, I totally get it. Otherwise, if there's anything else I can do to move this along, please let me know.
There is from me! Sorry I haven't gotten around to it yet. Let's get it moving. I'll give it a try tonight and start my review tomorrow.
Should I test it with DagMC stuff before we begin, though?
Yeah, I think that would be good. Have you given it a try?
Yeah, I think that would be good. Have you given it a try?
No, net yet. Who knows what will happen! I get the feeling the wireframe may look bad, if the surface ID of a facet is given by the facet ID. I usually don't compile with or use DAGMC since I've only been working on performance stuff and methods.
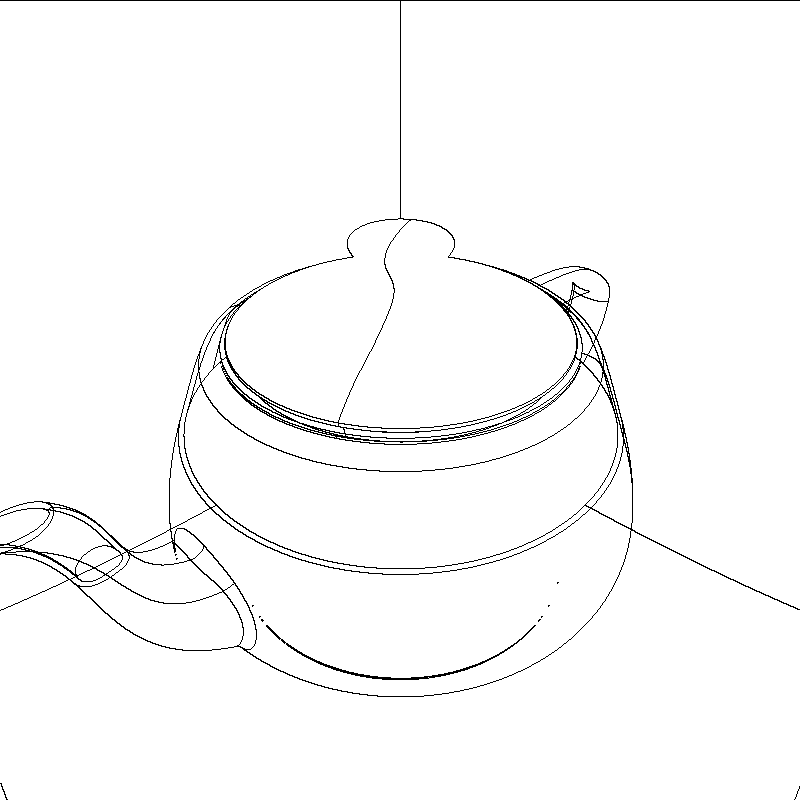
With a few tweaks, DAGMC geometry seems to work pretty well! Below is the Utah teapot from the CAD-based geometry example. I need to look into some unfortunate output in an upstream function though.
Hey @pshriwise, sorry to go off the grid on this one, but it has been on my to-do list.
The doc updates all sound good to me and I'll get to that, and renaming PlotInterface to PlotBase is certainly appropriate. The inheritance structure you suggest originally made the most sense to me too, but when I got to writing the code like that, I found that I could considerably minimize code delta by going with the design as it stands.
Moving the 3D pixel array into the plot base class doesn't make sense to me, since it doesn't get used at all in the projection plots. I think changing the semantics of what SlicePlotBase is would be best. Rather than thinking about it as a plot, I think we should just consider it as a Slice that holds a pixel array of some sort of data in the problem. Then the overlap coloring and such can go back into the Plot and VoxelPlot classes.
Looking at it that way, it makes sense for a SlicePlot to inherit from both PlotBase and Slice. Maybe it could be named PropertySlice or something like that. Could be useful elsewhere, too.
Yeah, you're right. I think keeping the data structures with their respective classes is the right call. It would be nice to factor out the voxel plot into its own class, but I agree that limiting the size of the delta is probably more important for now. That can be done later.
For got to add a comment before submitting my review...
What do you think of performing the wireframe update entirely separately from the parallel loop? If I understand correctly, the initial wireframe pass can still be performed in parallel under a separate loop. In addition to adding clarity and simplifying that main loop a bit, separating it might also make it easier to examine in case there is a way to parallelize the second pass too.
Hey Patrick, thanks for reviewing further! I'm going to get to this stuff after taking a final exam and finishing some class projects, but did want to address this.
The reason it's set up this way is because the memory usage in a two pass approach like that is excessively high. True, you could first loop through all pixels and cache the stack of cell intersections first, then loop over the intersection stacks to compute wireframe locations. That's not what I implemented here though: you only need n+1 lines of pixels where n is the number of threads in use.
This is because I calculated that the two loop approach can take up WAY too much memory for a model of interesting size. Suppose you have on average 50 cell intersections per pixel. Then for a 1920x1080 image, that's about 1.5 GB of data. For large models, it's easy to imagine a scenario where you run out of memory.
Maybe, though, I could add some developer documentation explaining the reasoning for the implemented approach. I could provide a pseudocode implementation of what your'e suggesting, then explain why that's not what's done in practice. Instead, you only need to know the adjacent horizontal line of pixels to correctly find the wireframe locations.
The reason it's set up this way is because the memory usage in a two pass approach like that is excessively high. True, you could first loop through all pixels and cache the stack of cell intersections first, then loop over the intersection stacks to compute wireframe locations. That's not what I implemented here though: you only need n+1 lines of pixels where n is the number of threads in use.
Ah, yeah that makes sense. Kinda forgot about processing the image lines in chunks. I'm going to think a bit more about this. Mainly, I think it would be nice to simplify the code in that loop a bit if possible 🤔
Maybe, though, I could add some developer documentation explaining the reasoning for the implemented approach. I could provide a pseudocode implementation of what your'e suggesting, then explain why that's not what's done in practice. Instead, you only need to know the adjacent horizontal line of pixels to correctly find the wireframe locations.
Additional comments never hurt 😄, but probably don't need to include pseudo-code or a justification. At least not yet anyway -- I'd like to monkey with the ordering and maybe data structures a bit first if that's okay with you.
Maybe, though, I could add some developer documentation explaining the reasoning for the implemented approach. I could provide a pseudocode implementation of what your'e suggesting, then explain why that's not what's done in practice. Instead, you only need to know the adjacent horizontal line of pixels to correctly find the wireframe locations.
Additional comments never hurt smile, but probably don't need to include pseudo-code or a justification. At least not yet anyway -- I'd like to monkey with the ordering and maybe data structures a bit first if that's okay with you.
Oh, if you come up with something simpler, please tear it to shreds! :smile:
Was making some input for a graphite pile today. Here's another example plot that I got from it.
@pshriwise have you monkeyed with the ordering and data structures yet? I believe we had talked about it briefly on slack, and my position is that changing up the ordering to make the code more readable can use excessive memory.
Ah, just saw those review comments I had missed. I'll address those soon and resolve the conflicts!
Ah, I may have accidentally force pushed and removed those dagmc changes you had incorporated, Patrick. I can try to rebase the latest commits on that stuff. Sorry, totally forgot about that stuff.
@pshriwise alright, I cherry-picked your dagmc hacks in, but one of them entails commenting out a section that marks particles as lost. Obviously that's not something we want to merge to develop, so it's up to you how we can handle this.
Do you recall why that was necessary? It seems to me that this is getting triggered only after a ray has left the geometry. In the case of the CSG intersections, we are just returning an infinite distance and invalid surface index. Maybe the dag cell should do the same?