I think Prometheus output have a memory leak that crashes the server it runs on.
We have noticed a strange behavior when we use any of the prometheus outputs that the ram usage of gnmic just keep going up and up until the server starts to swap and become unresponsive.
It works fine if we have around 20-30 devices but if we try to do 400+ devices we start getting problem. And thats just half of the devices we have. I tried strings-as-labels both false and true. For the scrape based prometheus i tried lower to cache timer does not work. For the remote write i played with buffer size, interval, max-time-series-per-write nothing helps. I do not have any event-processors.
If i use Kafka or file outputs instead i do not see a continuously increase in RAM usage.
CPU usage is ~25% 5min load average.
Metrics of RAM usage and below is a disk usage where you can see when we changed to file output that ram does not increase.
In the picture you can see at ~17:20 ram usage whent up a little that was when we added Kafka output.
insecure: true
encoding: PROTO
log: true
gzip: false
timeout: 60s
debug: false

api-server:
  address: :7890
  skip-verify: true
  enable-metrics: true


loader:
  type: http
  timeout: 60s
  enable-metrics: true
  tls:
    skip-verify: true
  url: "https://gnmic-inventory/gnmic/"


subscriptions:
  juniper:
    stream-subscriptions:
      - paths:
        - "/junos/system/linecard/interface"
        - "/interfaces/interface/ethernet/state/counters"
        stream-mode: sample
        sample-interval: 30s
      - paths:
        - "/interfaces/interface/state"
        - "/interfaces/interface/ethernet/state"
        stream-mode: sample
        sample-interval: 720s
      - paths:
        - "/interfaces/interface/state/oper-status"
        - "/interfaces/interface/state/admin-status"
        stream-mode: on-change
      - paths:
        - "/system/alarms"
        stream-mode: on-change
      - paths:
        - "/components/component"
        stream-mode: sample
        sample-interval: 60s
    encoding: proto
    mode: stream

outputs:
  prom-remote:
    type: prometheus_write
    url: https://collector-cortex/api/prom/push
    authorization:
      type: Bearer
      credentials: SECRET
    metric-prefix: gnmic
    buffer-size: 10000
    max-time-series-per-write: 1500
    interval: 10s
    max-retries: 0
    strings-as-labels: true
    enable-metrics: false
    tls:
    skip-verify: true
    debug: false

  file:
    type: file
    filename: /tmp/metrics.json
    format: event

  kafka-output:
    type: kafka
    name: gnmic
    address: REMOVED
    topic: metrics.juniper
    sasl:
      user: gnmic
      password: REMOVED
      mechanism: SCRAM-SHA-512
    tls:
      skip-verify: true
    format: event
    override-timestamps: false
    num-workers: 3
    debug: false
For the scrape based prometheus output, what was the scrape period on the prometheus side ?
For the remote write one, which values of interval and buffer did you try out ?
Also, can you set debug: true under the prometheus output section and share the logs ?
Scrape based was 15s intervals, scraped around 140-170k metrics each time.
Remote write i tried alot. intervals i tried 0.5,1,5,10s buffer-size: 1000,10000,30000,100000,400000 max-time-series-per-write: 500,1500,150000,200000 Debug log is full of this types of messages.
2023/10/03 16:40:44.478213 [prometheus_write_output:prom-remote] buffer size reached, triggering write
2023/10/03 16:40:44.478220 [prometheus_write_output:prom-remote] saving metrics metadata
2023/10/03 16:40:44.478222 [prometheus_write_output:prom-remote] writing TimeSeries to buffer
2023/10/03 16:40:44.478230 [prometheus_write_output:prom-remote] buffer full, writing to remote
2023/10/03 16:40:44.478239 [prometheus_write_output:prom-remote] write triggered, buffer size: 1000
2023/10/03 16:40:44.481562 [prometheus_write_output:prom-remote] writing a 500 time series chunk
2023/10/03 16:40:44.485274 [prometheus_write_output:prom-remote] got event to buffer: {"name":"juniper","timestamp":1696344042153000000,"tags":{"...........}
2023/10/03 16:41:02.644834 [prometheus_write_output:prom-remote] write response failed, code=400, body=user=Networks: err: out of order sample. timestamp=2023-10-03T14:40:45.289Z, series={__name__="gnmic_interfaces_interface_init_time",}
Higher buffer-size and max-time-series, still same problem with increasing ram.
2023/10/03 17:21:23.135720 [prometheus_write_output:prom-remote] write interval reached, writing to remote
2023/10/03 17:21:23.135783 [prometheus_write_output:prom-remote] write triggered, buffer size: 67980
2023/10/03 17:21:23.135736 [prometheus_write_output:prom-remote] saving metrics metadata
2023/10/03 17:21:23.135875 [prometheus_write_output:prom-remote] writing TimeSeries to buffer
2023/10/03 17:21:23.135954 [prometheus_write_output:prom-remote] got event to buffer: {"name":"juniper",
I was able to reproduce your issue, and I believe fix it in #235.
The root cause is the amount of gNMI subscribe responses that get passed to the outputs to handle. The kafka output (and other outputs) can take advantage of multiple workers to handle the responses (the num-workers: 3 in your example).
While prometheus and prometheus_write outputs handle messages in sequence. The messages end up being queued and take up all the memory.
I added the option to add workers to both outputs as well as a timeout for queued messages.
I tested both prometheus and prometheus_write outputs with num-workers: 10 while gNMIc subscribes to 400 targets sending each 500 gNMI Subscribe Responses per second every 10s (totaling 200k metrics).
I see a constant memory usage of ~600MB and ~450MB for prometheus and prometheus_write respectively.
Do you have an idea of the rate at which your 400 devices send gNMI notifications ? The metric should be available under gNMIc internal metrics.
My grpc_client_msg_received_total metric says between 10-12k msg every 15s
I compiled the fixed version and i have been running it now stable for 2h+.
A little bump in memory usage but that's expected.
Thanks for testing it.
If you don't mind sharing: how many workers did you set? Did you test both prometheus and prometheus_write? How much was the memory usage bump ?
We hit another issue as you can see in the picture above, our interface is only a 1Gb interface. Will comeback with our final configuration when we solve that.
Our log is full of, but i believe its because of the interface.
2023/10/04 14:34:12.474788 [prometheus_write_output:prom-remote] writing expired after 15s
2023/10/04 14:34:12.474813 [prometheus_write_output:prom-remote] writing expired after 15s
2023/10/04 14:34:12.474585 [prometheus_write_output:prom-remote] writing expired after 15s
2023/10/04 14:34:12.474970 [prometheus_write_output:prom-remote] writing expired after 15s
2023/10/04 14:34:12.474980 [prometheus_write_output:prom-remote] writing expired after 15s
2023/10/04 14:34:12.475001 [prometheus_write_output:prom-remote] writing expired after 15s
2023/10/04 14:34:12.475014 [prometheus_write_output:prom-remote] writing expired after 15s
Would it be possible to get some prometheus write output metrics like there is for kafka to correlate with the grpc_client_msg_received_total
e.g number_of_prometheus_write_msgs_sent_success_total number_of_prometheus_write_msgs_sent_fail_total
Added a few metrics to both outputs:
gnmic_prometheus_output_number_of_prometheus_metrics_total 200000
gnmic_prometheus_write_output_metadata_msg_send_duration_ns 949876
gnmic_prometheus_write_output_msg_send_duration_ns 909873
gnmic_prometheus_write_output_number_of_prometheus_write_metadata_msgs_sent_fail_total{reason=""} 0
gnmic_prometheus_write_output_number_of_prometheus_write_metadata_msgs_sent_success_total 200
gnmic_prometheus_write_output_number_of_prometheus_write_msgs_sent_fail_total{reason=""} 0
gnmic_prometheus_write_output_number_of_prometheus_write_msgs_sent_success_total 1e+06
Only been trying prometheus_write. Memory bump seems to be around 4-6Gb.
We are still seeing [prometheus_write_output:prom-remote] writing expired after 20s. Waiting for our monitor team help us troubleshoot there side and help us tweak gnmic parameters even more.
Some config changes we done. Until 15:54
    buffer-size: 10000000
    max-time-series-per-write: 10000
    num-workers: 20
    interval: 5s
    timeout: 20s
15:54 -16:07
    buffer-size: 10000000
    max-time-series-per-write: 10000
    num-workers: 10
    interval: 1s
    timeout: 20s
16:07+ (at 16:25 i changed to jumboframes only)
    buffer-size: 1000000
    max-time-series-per-write: 2000
    num-workers: 10
    interval: 1s
    timeout: 20s
latest config gave us less timeouts and we continuously having more total writes towards prometheus then incomming grpc messages.
I think having more writes towards prometheus than incoming gRPC messages makes sense. A single Subscribe Response can hold multiple updates and those updates could have JSON values that map to multiple prometheus metrics.
Ye that's what i thought also. How are the workers working internally? e.g Are they working independently or working together to process and write messages?
Yes workers are independent, they handle incoming messages by converting them to prometheus metrics and write them to a buffer. Then there is a single goroutine that drains the buffer periodically or when it reaches the max buffer size and writes the metrics to the remote prometheus server. Timeouts happen when there is no worker available to handle messages, which implies that all workers are pending to write to the buffer. That means the buffer is probably full because it's not being drained fast enough. This is, I think, confirmed by your config changes at 15:54. Going from interval 5s to 1s allowed the number of messages written to prometheus to climb up again above the number of received gRPC messages.
Can that single goroutine that drains the buffer be a bottleneck? Just setting a low interval e.g 1s or even sub-second i dont feel is enough to drain the buffer fast enough. And having high buffer-size and max-time-series-per-write will cause the write duration to become higher then the interval.
It feels like i am not able to get more then 13-16k of written messages to Prometheus per second. Having 10 workers or 200 workers is also not noticeable in the output of messages.
Kafka workers they don't use a shared buffer like prometheus i guess? Since there is a metric created for each producer_id i guess they take care of the processing and writing.
Can that single goroutine that drains the buffer be a bottleneck? Just setting a low interval e.g 1s or even sub-second i dont feel is enough to drain the buffer fast enough. And having high buffer-size and max-time-series-per-write will cause the write duration to become higher then the interval.
The reason there is a single goroutine writing to prometheus is the in-order requirement from prometheus side, see here. If we use multiple workers, there is no way to guarantee that metrics part of the same series are sent in order.
It feels like i am not able to get more then 13-16k of written messages to Prometheus per second. Having 10 workers or 200 workers is also not noticeable in the output of messages.
The workers are used on the input side, their number will not have an impact on the output performance. I would try with low interval and a max-time-series-per-write amount close to the buffer size.
Kafka workers they don't use a shared buffer like prometheus i guess? Since there is a metric created for each producer_id i guess they take care of the processing and writing.
The Kafka output workers use the same buffer, but there is no in-order requirement when writing to a Kafka topic. So we can use as many workers are needed.
Can that single goroutine that drains the buffer be a bottleneck? Just setting a low interval e.g 1s or even sub-second i dont feel is enough to drain the buffer fast enough. And having high buffer-size and max-time-series-per-write will cause the write duration to become higher then the interval.
The reason there is a single goroutine writing to prometheus is the in-order requirement from prometheus side, see here. If we use multiple workers, there is no way to guarantee that metrics part of the same series are sent in order.
There is no longer a in-order requirement.
Prometheus has experimental support to accept out-of-order samples. It was added in 2.39.0 https://github.com/prometheus/prometheus/discussions/11415 Its still a experimental feature it seems. https://prometheus.io/docs/prometheus/latest/configuration/configuration/#tsdb
We are using Cortex at our company and they introduced support for out-of-order samples in 1.15.0. Waiting for our prod env to be updated that will probably solve some of my issues. https://github.com/cortexproject/cortex/releases/tag/v1.15.0
Can the metric gnmic_prometheus_write_output_number_of_prometheus_write_msgs_sent_fail_total be improved/removed? Today there is one big label called reason that contains to much detailed info and even a timestamp that will cause high cardinality for that metric series if run over a long period of time.
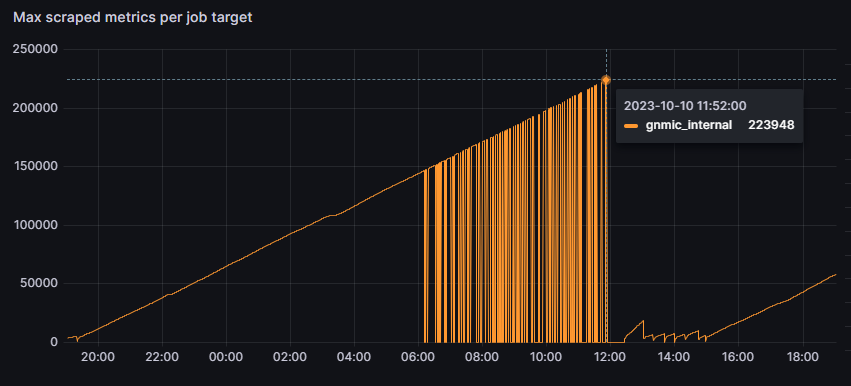
In my case i have alot of out of order sample. And the metrics to be scraped over gnmic API just goes up up up.
I does not have to be that detailed just having the reason, code and why it failed e.g out of order, duplicate sample for timestamp, timestamp too old in the metric.
The log message created should contain the more detailed info.
Like its done for the metric grpc_client_handled_total The log contains:
2023/10/10 17:11:37.854744 [gnmic] target "switch1": subscription interface_state rcv error: rpc error: code = OutOfRange desc = Maximum number of Subscribe requests reached
2023/10/10 17:11:37.855398 [gnmic] target "switch2": subscription interface_state rcv error: rpc error: code = Unavailable desc = JGrpcServer: Unknown RPC /gnmi.gNMI/Subscribe received
While the metric just counts on
grpc_client_handled_total{grpc_code="InvalidArgument",grpc_method="Subscribe",grpc_service="gnmi.gNMI",grpc_type="bidi_stream"} 1227
grpc_client_handled_total{grpc_code="OutOfRange",grpc_method="Subscribe",grpc_service="gnmi.gNMI",grpc_type="bidi_stream"} 11365
grpc_client_handled_total{grpc_code="Unavailable",grpc_method="Subscribe",grpc_service="gnmi.gNMI",grpc_type="bidi_stream"} 1.308698e+06
Can that single goroutine that drains the buffer be a bottleneck? Just setting a low interval e.g 1s or even sub-second i dont feel is enough to drain the buffer fast enough. And having high buffer-size and max-time-series-per-write will cause the write duration to become higher then the interval.
The reason there is a single goroutine writing to prometheus is the in-order requirement from prometheus side, see here. If we use multiple workers, there is no way to guarantee that metrics part of the same series are sent in order.
There is no longer a in-order requirement.
Prometheus has experimental support to accept out-of-order samples. It was added in 2.39.0 prometheus/prometheus#11415 Its still a experimental feature it seems. https://prometheus.io/docs/prometheus/latest/configuration/configuration/#tsdb
We are using Cortex at our company and they introduced support for out-of-order samples in 1.15.0. Waiting for our prod env to be updated that will probably solve some of my issues. https://github.com/cortexproject/cortex/releases/tag/v1.15.0
OK, I wasn't aware that the requirement was removed, but considering that remote_write is used by other systems (cortex in your case) it makes sense to ignore it and allow for multiple writers. I will add a configurable number of workers on the write side.
Can the metric gnmic_prometheus_write_output_number_of_prometheus_write_msgs_sent_fail_total be improved/removed? Today there is one big label called reason that contains to much detailed info and even a timestamp that will cause high cardinality for that metric series if run over a long period of time.
In my case i have alot of out of order sample. And the metrics to be scraped over gnmic API just goes up up up.
I does not have to be that detailed just having the reason, code and why it failed e.g out of order, duplicate sample for timestamp, timestamp too old in the metric.
The log message created should contain the more detailed info.
Like its done for the metric grpc_client_handled_total The log contains:
2023/10/10 17:11:37.854744 [gnmic] target "switch1": subscription interface_state rcv error: rpc error: code = OutOfRange desc = Maximum number of Subscribe requests reached
2023/10/10 17:11:37.855398 [gnmic] target "switch2": subscription interface_state rcv error: rpc error: code = Unavailable desc = JGrpcServer: Unknown RPC /gnmi.gNMI/Subscribe received
While the metric just counts on
grpc_client_handled_total{grpc_code="InvalidArgument",grpc_method="Subscribe",grpc_service="gnmi.gNMI",grpc_type="bidi_stream"} 1227
grpc_client_handled_total{grpc_code="OutOfRange",grpc_method="Subscribe",grpc_service="gnmi.gNMI",grpc_type="bidi_stream"} 11365
grpc_client_handled_total{grpc_code="Unavailable",grpc_method="Subscribe",grpc_service="gnmi.gNMI",grpc_type="bidi_stream"} 1.308698e+06
Yep, will fix that, I just blindly put the error as a label without considering the different values
@Sparc0 if you build from #247 , you can configure the number of writers with num-writers: 10
All the writers will be triggered periodically every interval. I could also add a randomization of the interval (±10%) to avoid all the writers writing to prometheus at the same time.
When the buffer size reaches buffer-size one of the writers will be triggered to drain the buffer and write to prometheus.
There is still a single metadata writer that gets triggered every interval
I also changed the gnmic_prometheus_write_output_number_of_prometheus_write_msgs_sent_fail_total metric label to take only a few values:
-
client_failure: Incremented if the client fails to connect -
status_code=$status_code: Incremented if the response code is higher than 300 -
marshal_error: incremented if the client failed to marshal the write request
i compiled it to test the metric part only while i am waiting to get access to our staging cortex to test num-writers.
Metric i get is
gnmic_prometheus_write_output_number_of_prometheus_write_msgs_sent_fail_total{reason="status_code=400"} 1234
I believe that's the out of order delivery error, it can happen with multiple workers as well. Maybe I should create a buffer per series and reorder before writing to the remote endpoint.
been trying this pull with multiple remote writers now towards our staging env. I still see out of order samples but not as many as before.
Will change this cortex setting to 6h see if that improves things.
If it's a sliding window I think it should be enough to set it slightly higher than twice the prometheus_write output interval value.
Hi there, first poster here. I have started testing GNMIC cluster in kuberentes, I also see out of order samples, this is also with very small amounts of metrics coming in.
@lazyb0nes can you share which version of gnmic you are running and a snippet of the output config ?
@karimra hello,
Certainly
Currently running version 0.31.1, so maybe updating to the latest version shoudl be the first thing i should do?, i've also in grafana seen somthing really odd, basically the metric 'gnmic_interfaces_interface_state_counters_out_octets' has only 1 entry if I look in mimir. But I still see dual entries in the legend in Grafana, can this be realted to the out of order samples?
outputs:
  output1:
    type: prometheus_write
    url: https://mimir.example.com/api/v1/push
    headers:
      tenantid: 'gnmictest'
    tls:
      skip-verify: true
    interval: 10s
    buffer-size: 1000
    max-time-series-per-write: 500
    max-retries: 0
    metadata:
      include: false
      interval: 60s
      max-entries-per-write: 500
    metric-prefix: "gnmic"
    append-subscription-name: false
    strings-as-labels: true
    timeout: 10s
    debug: true
    add-target:
    target-template:
    event-processors:
@karimra Slight update, after updating to 0.34.2 I am not as far as I can see seeing an out of order samples anymore.
What i am seeins is this however
failed to convert message to event: invalid character 'i' in numeric literal
What could be causing this?
probably same as: #240
So the interesting here is that we see that but we also do see the correct values in prometheus. So it's handled at least to a certain point.
@karimra thank you for all the good works that's been done with GNMIC so far i am pushing over 90,000 metrics/s into it and I so far haven't seen many issues apart from Juniper not presenting the data in a very usable manner at times.
It seems Juniper sends correct float values as well as -inf. So the float values show up properly in Prometheus.
90k/s is probably the biggest rate I head someone pushed into gNMIc, do you mind sharing a bit more details about your setup? If not here, we can do that via email or a zoom call. I'm interested in what people are doing with gNMIc to figure out where it can be further optimized.
Sure i'd be happy to take it over a call. This is also still very much a proof of concept, when i go into full production i will probably have around 2000-2500 devices in total. Juniper and Cisco mainly.
I would be interested to know also and to share our setup and learn how you might have done. Our most busiest collector today has 900 devices loaded and 17k metrics/s incoming. Having only Juniper devices.
@Sparc0 I don't know what the best way to discuss this would be let me know and we can have a talk and discuss this all. Ideally it would be nice if the community as a whole can benefit :)