explorer

explorer copied to clipboard
Add a geographic visualization/animation representing OONI probe activity
We should explore the idea of adding a visualization that captures the global nature of the data OONI probes collect.
If not based on realtime data, this could also be just an animation created using real data and timestamps.
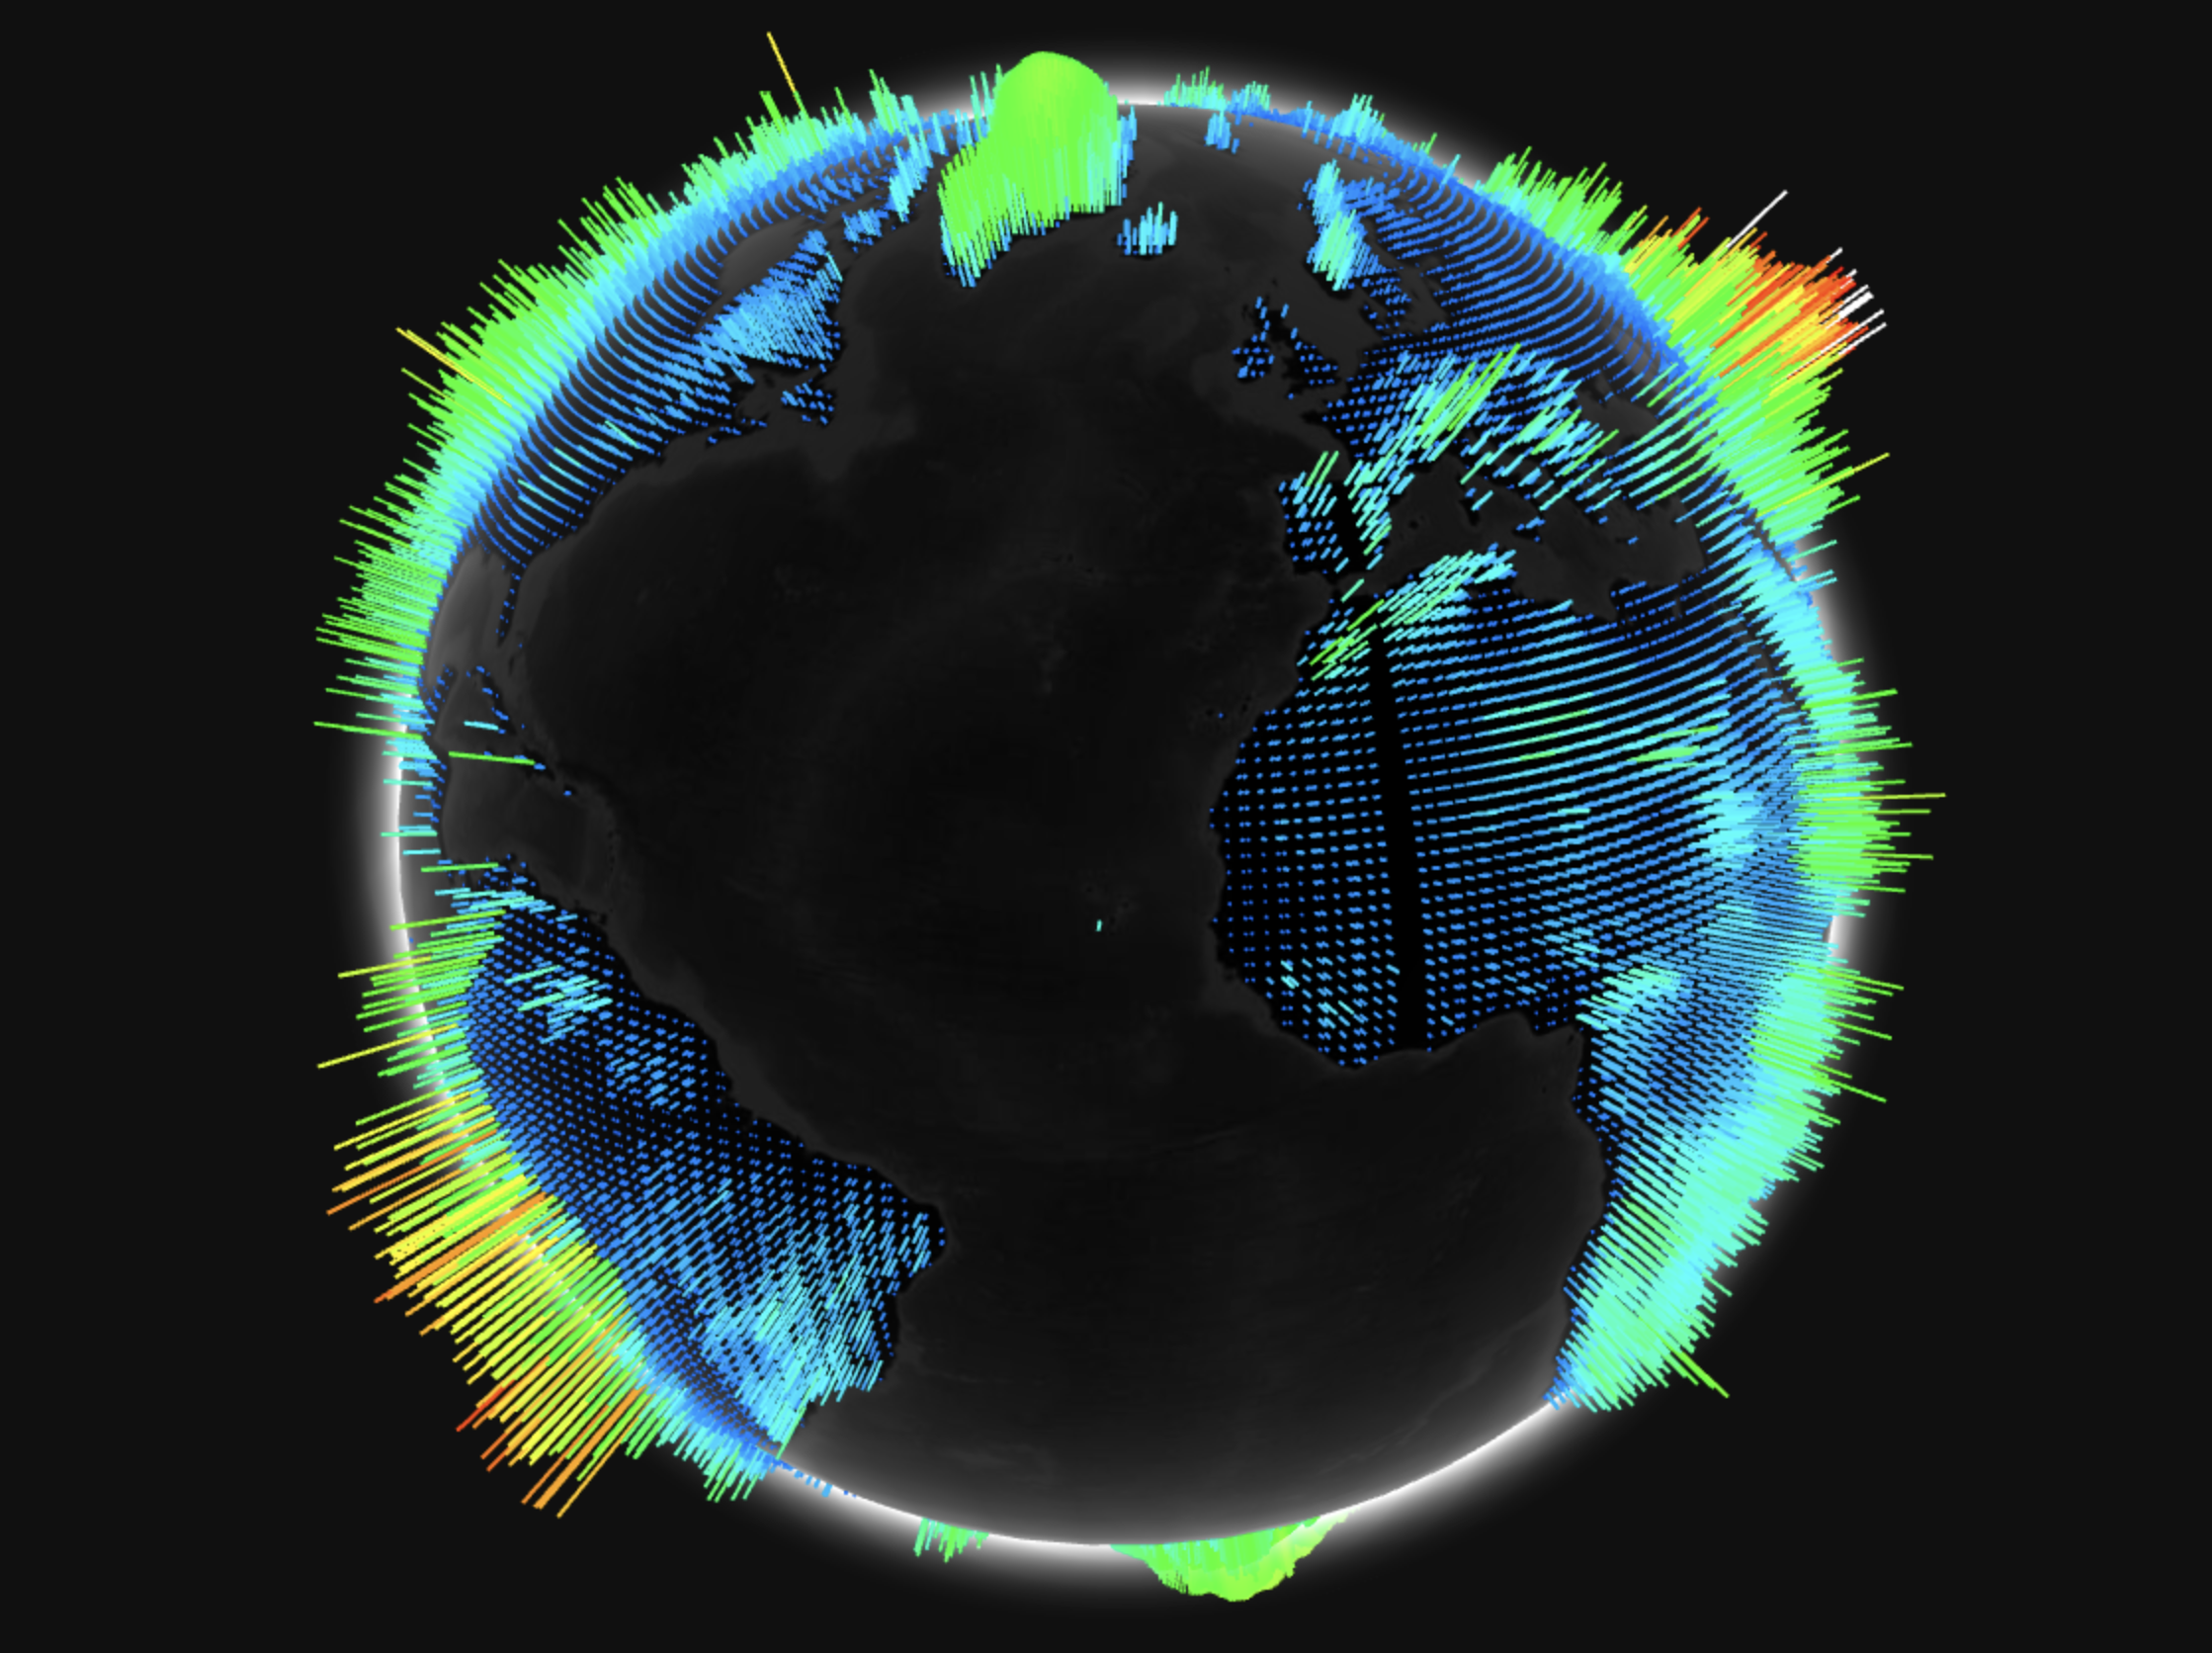
An earlier iteration of the project had an interactive globe that showed some data, which looked similar to this.
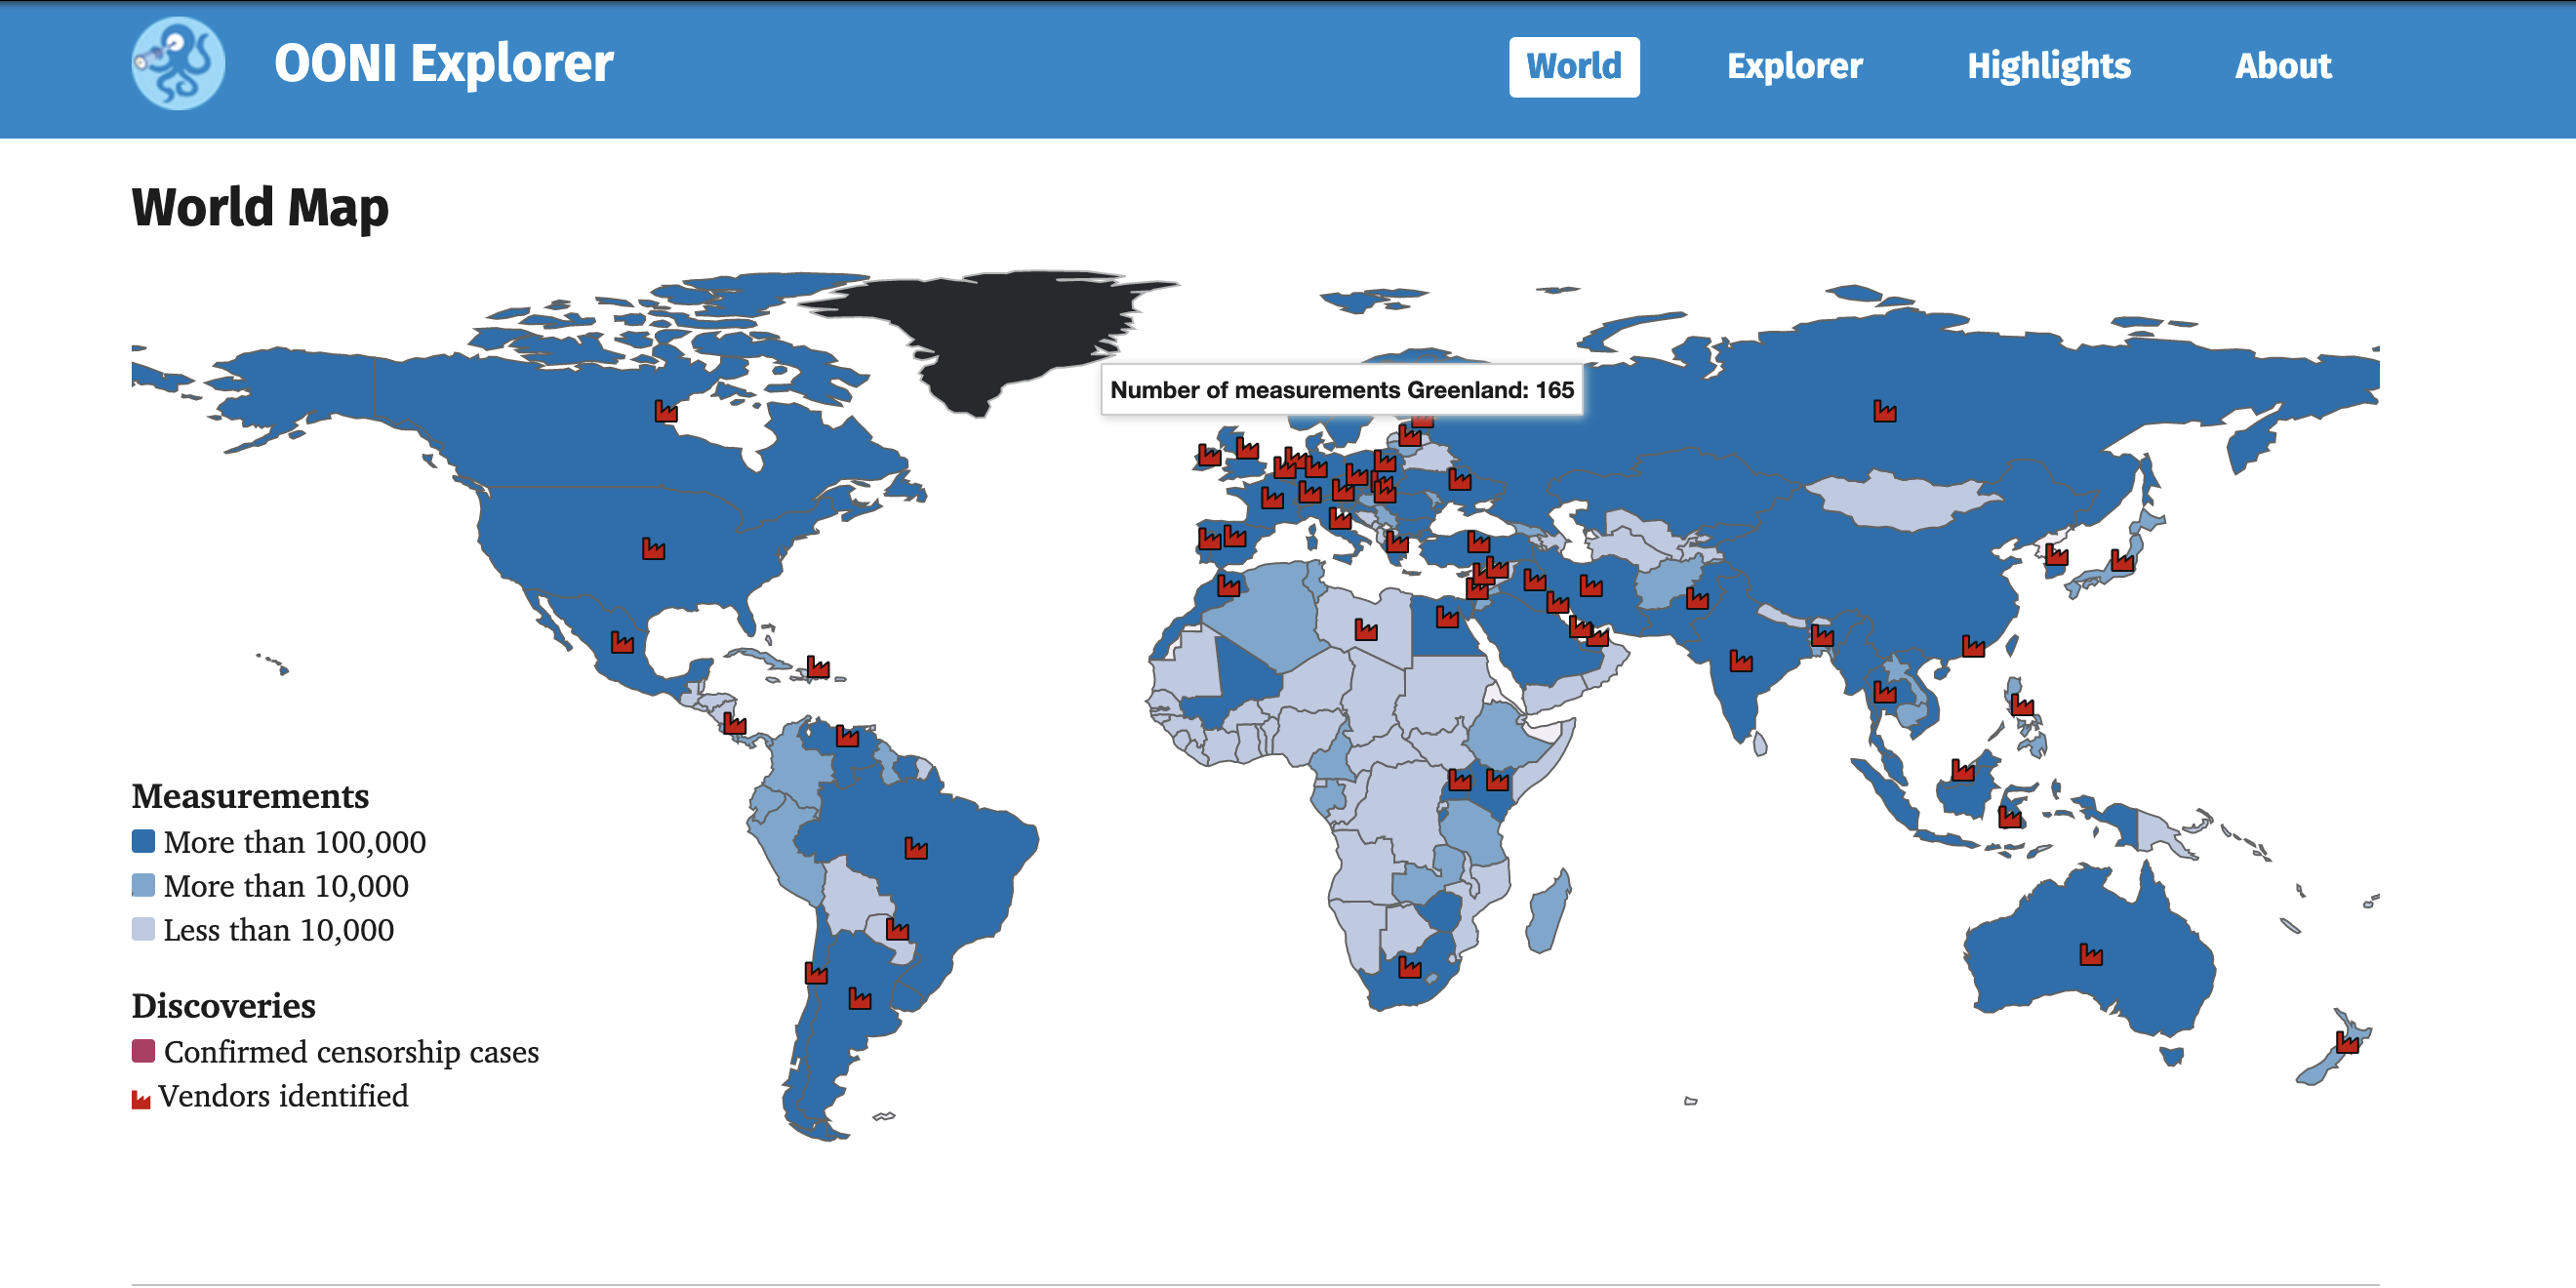
The older version of OONI Explorer had a world map visualizing the number of measurements collected per country.