Add Enrich option for OpenTelemetry
I'm using the new OpenTelemetry stuff and it's great. It was trivial to add and immediately instrumented my queries. Thanks so much!
However,the traces weren't super useful. Here's an example of how this looks in my tracing provider (this is honeycomb):
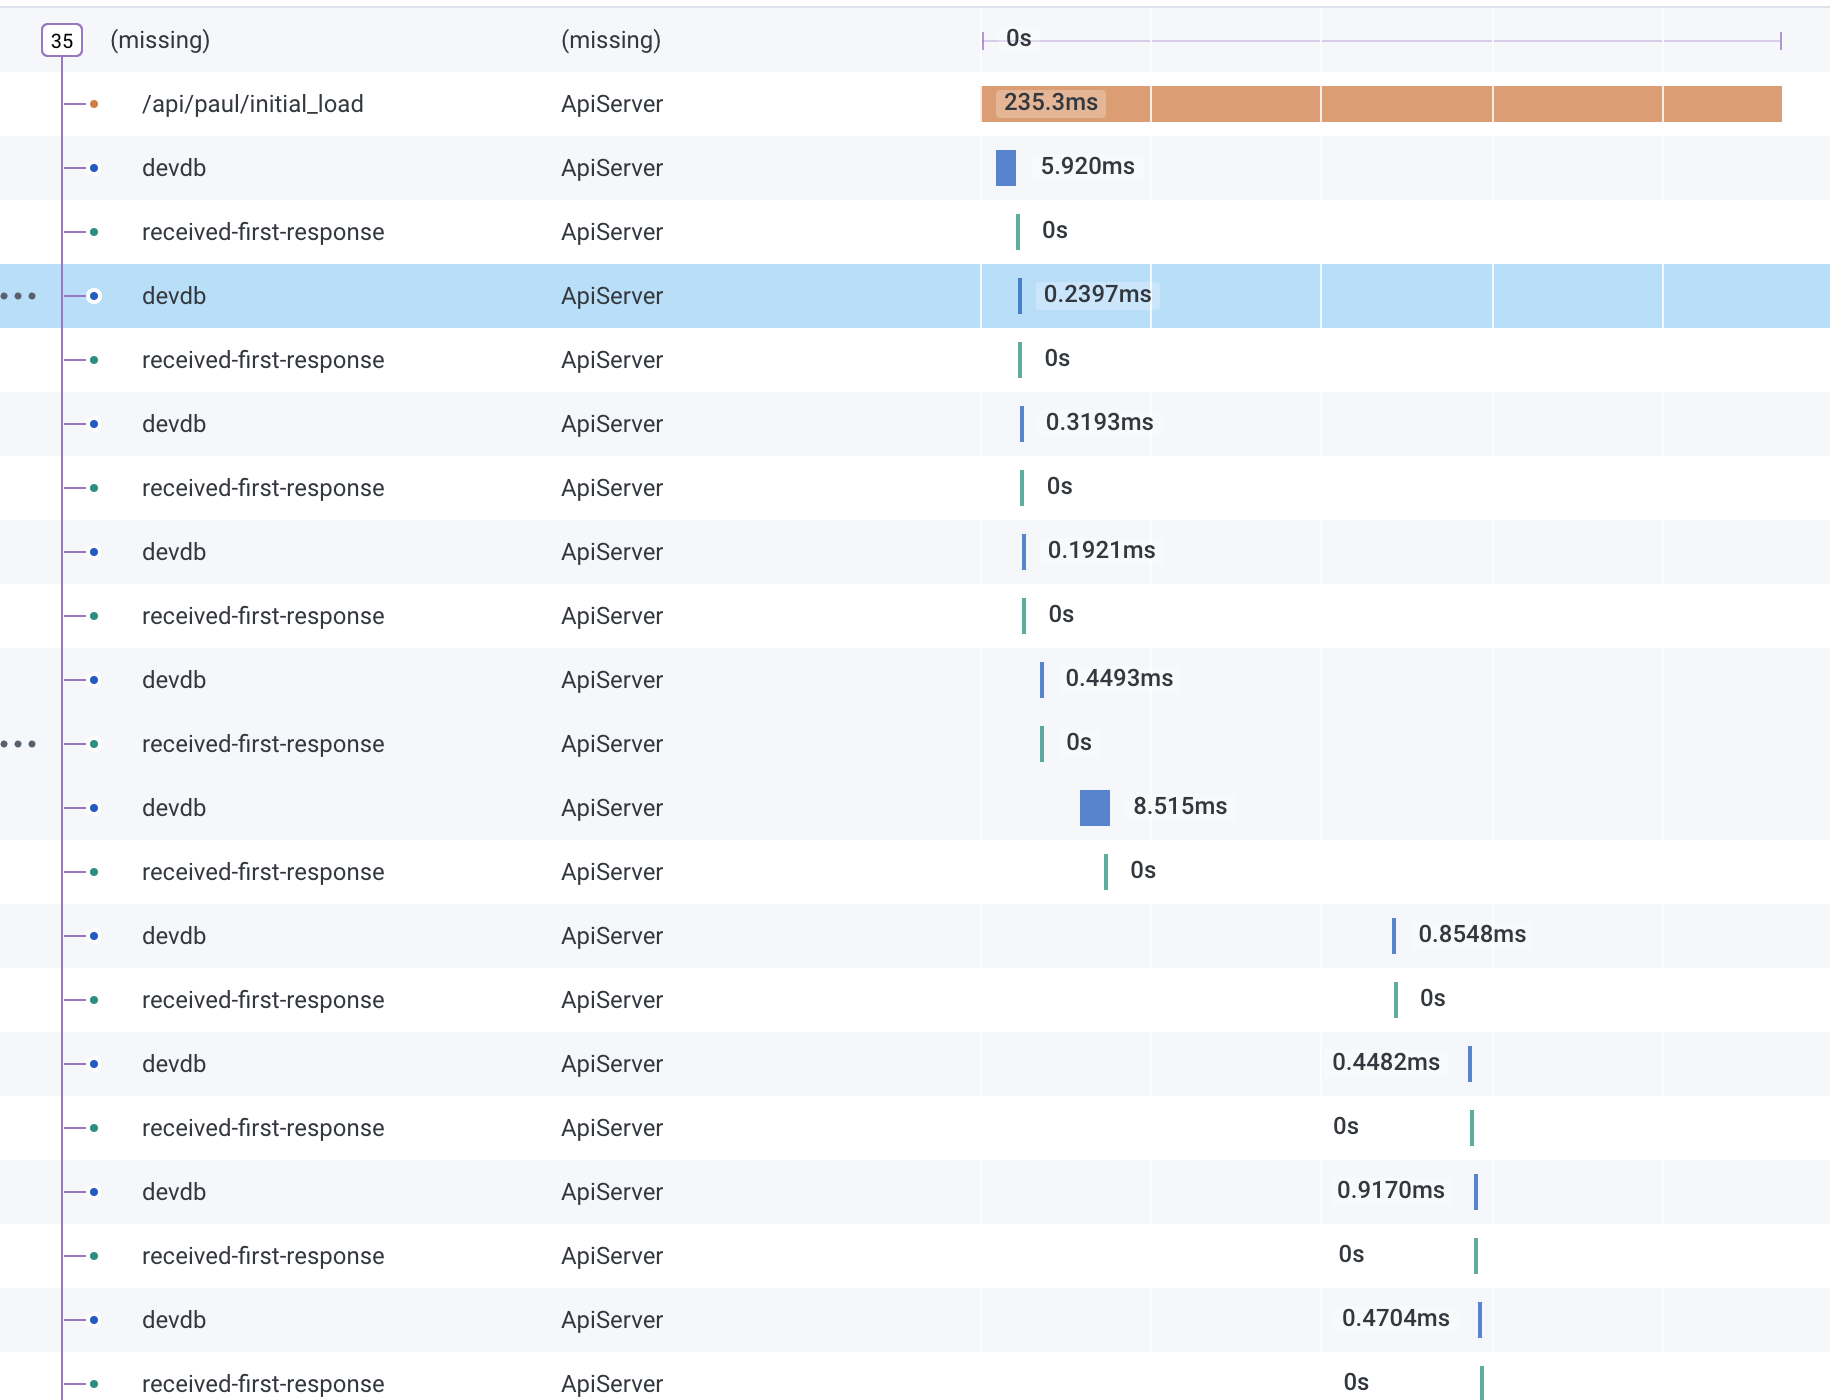
Every SQL query span is called the name of the DB being accessed. This makes it difficult to understand what's going on at a glance.
I looked in the code, and there doesn't seem to be any configuration ability here.
It seems the standard way to customize an Activity in .NET is to use an Enrich field in the OpenTelemetryOptions. Here is one example, but I believe all the libraries I've seen have this.
The things that I would like to "Enrich" are to change the name of the source (maybe I can do that using DisplayName) and to list some parameters to add as Tags.
@pbiggar great to get feedback about the OpenTelemetry support, and to know it was so easy to set up!
FWIW these are early days for the OpenTelemetry support - I do intend to work on it and improve it for 7.0 (https://github.com/npgsql/npgsql/issues/4038 tracks possible directions).
So first, the name of the span/activity follows the current draft for OpenTelemetry specifications for database semantic conventions; in other words, we're just following the current standard here. The SQL itself is definitely traced - if you click on a span you should be able to see it (can you confirm that?).
Regarding Enrich - thanks, I wasn't aware of that; a similar thing in Npgsql definitely may make sense - it would allow you to set the span name (or anything else) as you see fit.
Wonderful, thanks for the thorough response!
So first, the name of the span/activity follows the current draft for OpenTelemetry specifications for database semantic conventions; in other words, we're just following the current standard here. The SQL itself is definitely traced - if you click on a span you should be able to see it (can you confirm that?).
Yes, I can see the SQL traced.
Thanks for the link to the spec, very interesting. It seems that the name is intended to be in the format (<db.operation> <db.name>.<db.sql.table>), but db.operation and db.sql.table are not known, it falls back to just db.name.
So another way to help get good output here would be to include a means to provide the table name and the operation to the query (I'll note that spec says parsing the sql for this info is verbotten, that's probably for the best).
It seems like if we provide an Enrich feature like the Redis example you posted above, users would be able to do what they want, e.g. parse the SQL to extract the table names (though that would be brittle/risky), possibly use the entire SQL (or some truncated version of it), etc.
Aside from that, I plan to work on the OpenTelemetry specs themselves; this may include proposals to change the recommended span name.
It seems like if we provide an Enrich feature like the Redis example you posted above, users would be able to do what they want, e.g. parse the SQL to extract the table names (though that would be brittle/risky), possibly use the entire SQL (or some truncated version of it), etc.
Agreed. Npgsql could potentially even provide the functionality to do the parsing, with adequate warning to proceed at your own risk.
Agreed. Npgsql could potentially even provide the functionality to do the parsing, with adequate warning to proceed at your own risk.
This isn't something we're likely to do - we very intentionally avoid parsing SQL in the driver (quite a lot of work in Npgsql 6.0 went towards allowing executing command without looking at the SQL at all). Finding even a table name in the SQL can be an extremely complicated exercise, with multiple tables being present, more complicated SQL constructs (e.g. common table expressions with WITH), etc.
If users would like to plug in some external component to do the parsing for them, they should have the possibility of doing so, but I don't think we'll provide that component.
Definitely interested in this. We are migrating from SqlServer where we were able to log deeper info than standard logs by using the "Enrich" hook for SqlServer instrumentation and just now discovering that this library doesn't have that. Would love to see it added at some point so we can get some more useful logging again.
Note: stuff that we are hoping to log would be the parameters that were passed into functions. We are using parameterized strings appropriately, but the end result is that we are seeing the log as "select * from public.myfunction(p0, p1, p2, p3)" and for spans that failed that doesn't quiet give us as much info as we'd like to diagnose an issue. Knowing exactly how it was invoked would be a great step ahead to knowing what went wrong at a glance or at least getting closer to the issue so we can reproduce it closer to the DB.
@btvanhooser it's important to distinguish between logging and tracing; Npgsql already has a pretty extensive logging feature (which should be more similar to what SqlClient calls "tracing") - I suggest looking at that and possibly changing the log level to debug or trace.
Tracing here is used in the OpenTelemetry sense of emitting distributed activities with start/end that can be plotted etc.
Correct, I'm referring to the information included in the activity that is sent with the trace via the exporter to the collector (in this case, Datadog). The call information and parameters are included with our current trace that is exported to the DataDog collector, but since the migration to PostgreSQL we don't have access to that information anymore. That is because that information was previously added with the enrich method which allowed us to intercept certain activities and add those detailed logs to those traces.
I definitely understand we can use a more traditional log as a backup for debugging purposes, but having that information in the trace was useful to us since we could have a log to failures and what queries were ran to cause those failures. It's just nice to skip a step so I'm trying to get back to that.
@btvanhooser it would be good to know exactly which information you're looking to enrich the tracing with.
Here's an example of the current implementation on SqlClient (for SQL Server). You can see that we are specifically handling the provided "SqlCommand" parameter and pulling information out of it. The main thing that I'd be wanting are the parameters provided to the SQL statement we are trying to execute. I apologize for not being able to map between the two libraries on terminology since I'm still getting familiar with the process changes between them but if you are familiar with what'd be closest to that then just exposing that in the Enrich method would allow me to get the information out and log them as wanted.
In our case we don't have to worry about sensitivity since we are largely an internal team and don't deal with PII or anything so logging deeper information like this is helpful while still not being risky.
.AddSqlClientInstrumentation(options =>
{
    options.SetDbStatementForText = true;
    options.EnableConnectionLevelAttributes = true;
    options.RecordException = true;
    options.Enrich = (activity, eventName, rawSqlCommand) =>
    {
        if (eventName != "OnCustom" ||
            rawSqlCommand is not DbCommand cmd) return;

        activity.AddTag("db.command_name", cmd.CommandText);

        if (cmd.Parameters.Count == 0) return;

        var parameterList = cmd.Parameters.Cast<DbParameter>()
            .ToList()
            .Aggregate("", (result, parameter) =>
                result +
                $"{parameter.ParameterName} = {parameter.Value}{Environment.NewLine}");
        activity.AddTag("db.statement.parameters", parameterList);
    };
});
That looks really similar to what I was proposing in https://github.com/npgsql/npgsql/pull/4284:
.AddNpgsql(options =>
{
    options.EnrichCommandExecution = (activity, eventName, rawNpgsqlCommand) =>
    {
        if (rawNpgsqlCommand is not NpgsqlCommand cmd) return;

        // etc.
    }
});
I'm happy to revive that, if agreeable to @roji, and probably update it to have strongly typed "Enrich" method signatures, similar to how other instrumentation libraries have evolved over the last couple of years (e.g. AspNetCore, HttpClient).