wpa

wpa copied to clipboard
Feature request: add average total bars to bar plots
It would be good to add average total bars to the bottom of bar plots automatically.
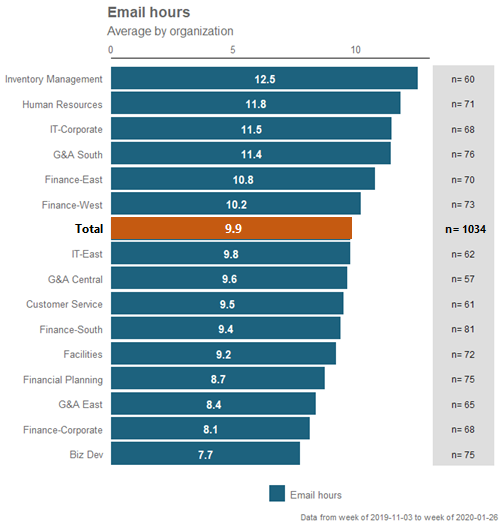
Currently, there is a workaround to approximate the above results:
sq_data %>% totals_bind(target_col = "Organization") %>% collab_sum()
Check out this example:
plot.sale.bad2 <- ggplot(data=df.sale,
                         aes(x=area,
                             y=sale,
                             fill=factor(ifelse(area=="Południe","Highlighted","Normal")))) +
  geom_bar(stat="identity") +
  scale_fill_manual(name = "area", values=c("red","grey50")) +
  xlab(colnames(df.sale)[1]) +
  ylab(colnames(df.sale)[2]) +
  ggtitle("Porównanie sprzedaży")

plot.sale.bad2