Tensorboard visualization tool for MLP, XGBoost and CatBoost
Description
TensorBoard provides the visualization and tooling needed for machine learning experimentation such as tracking and visualizing metrics such as loss and accuracy, visualizing the model graph (ops and layers) and much more.
Motivation and Context
This tool can bring features that will help to analyze the loss of the model being applied as well as finacial metrics in order to understand how well one model is being trained and validated.
How Has This Been Tested?
- [x] Pass the test by running:
pytest qlib/tests/test_all_pipeline.pyunder upper directory ofqlib. - [x] If you are adding a new feature, test on your own test scripts.
In order to test such feature just execute any of the following
ymlfiles: -
workflow_config_xgboost_Alpha360.yaml, -
workflow_config_catboost_Alpha360.yamland -
workflow_config_mlp_Alpha360.yaml
Screenshots of Test Results (if appropriate):
- Pipeline test:
- Your own tests:
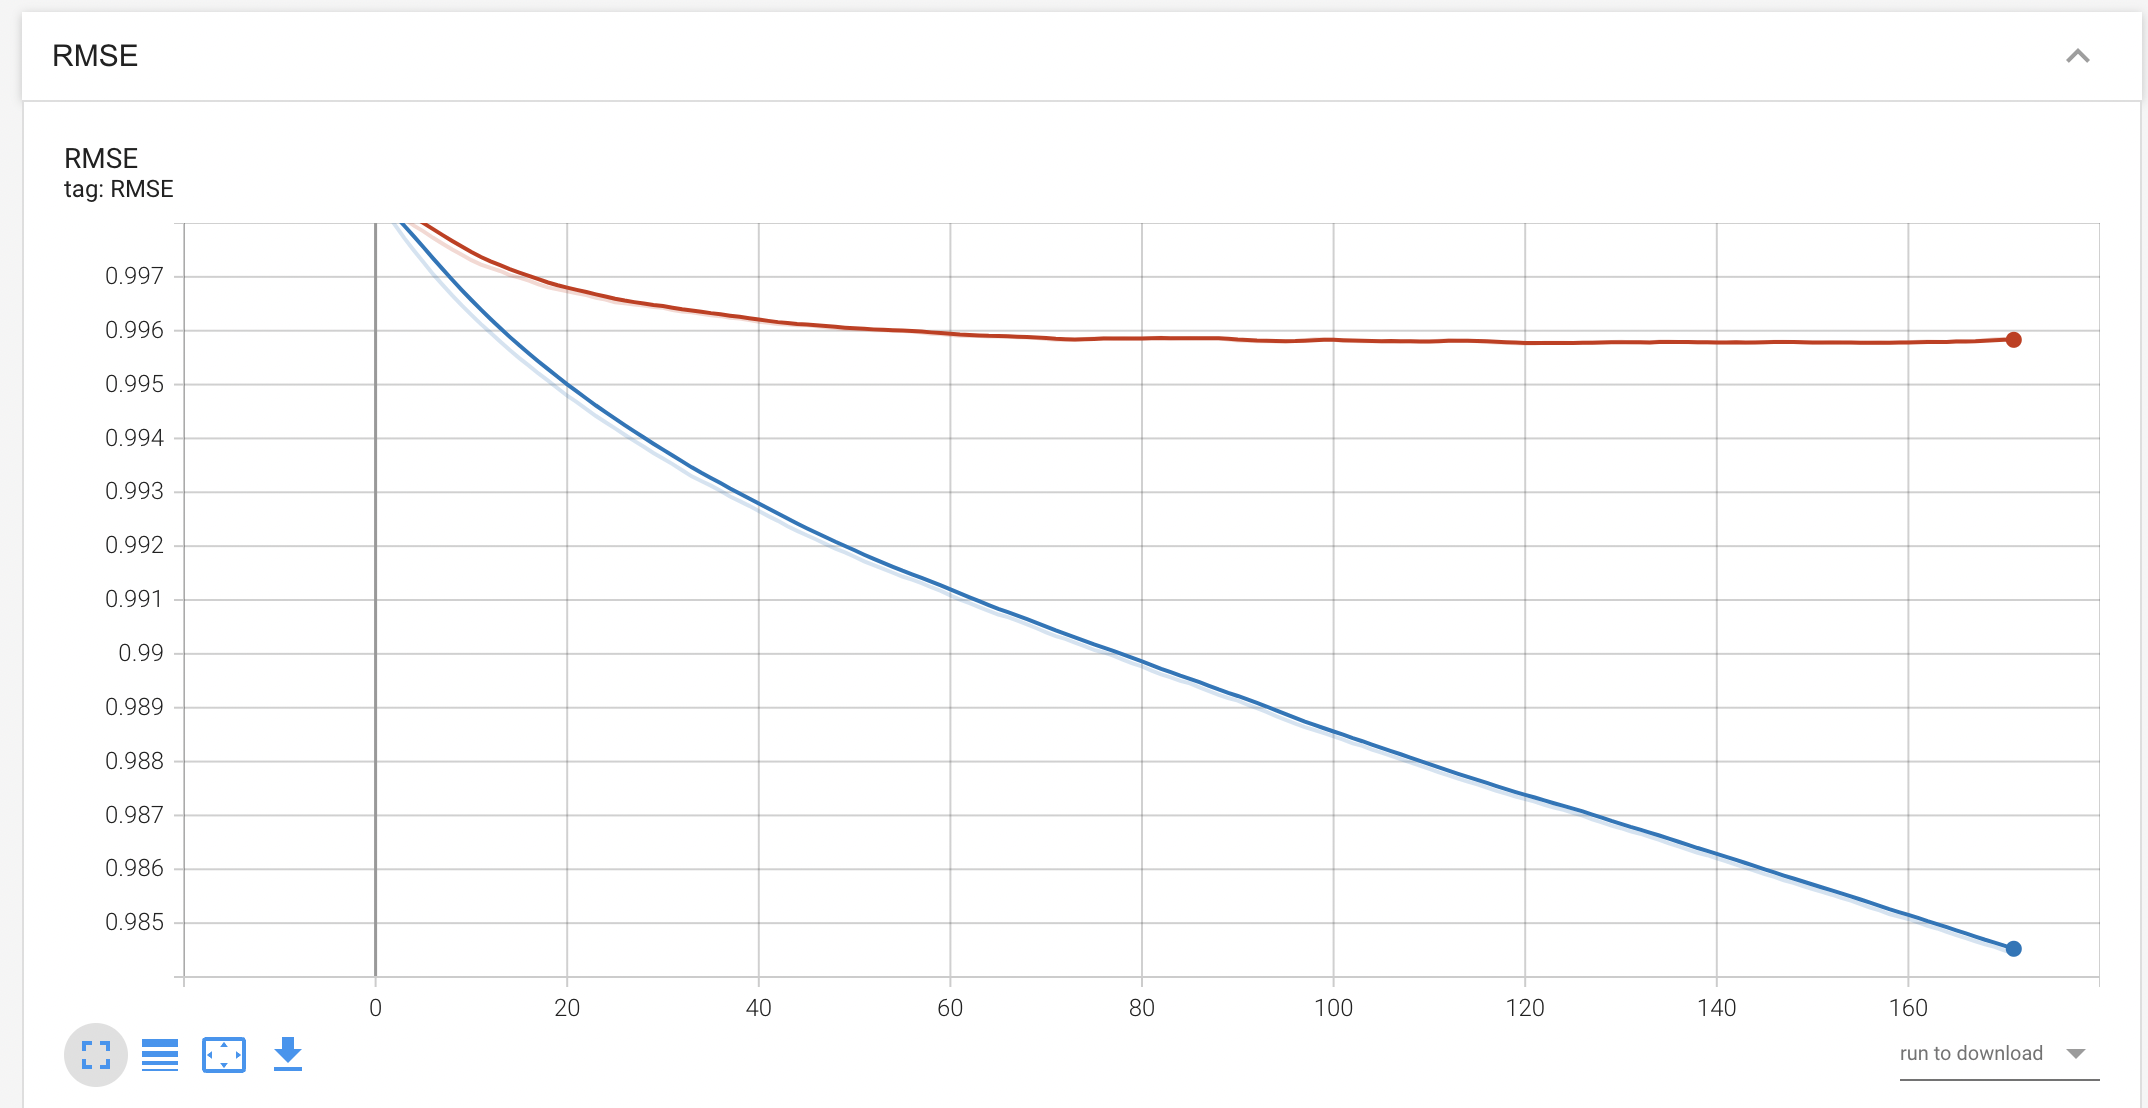
RMSE for each step on training and validation iterations for CatBoost:
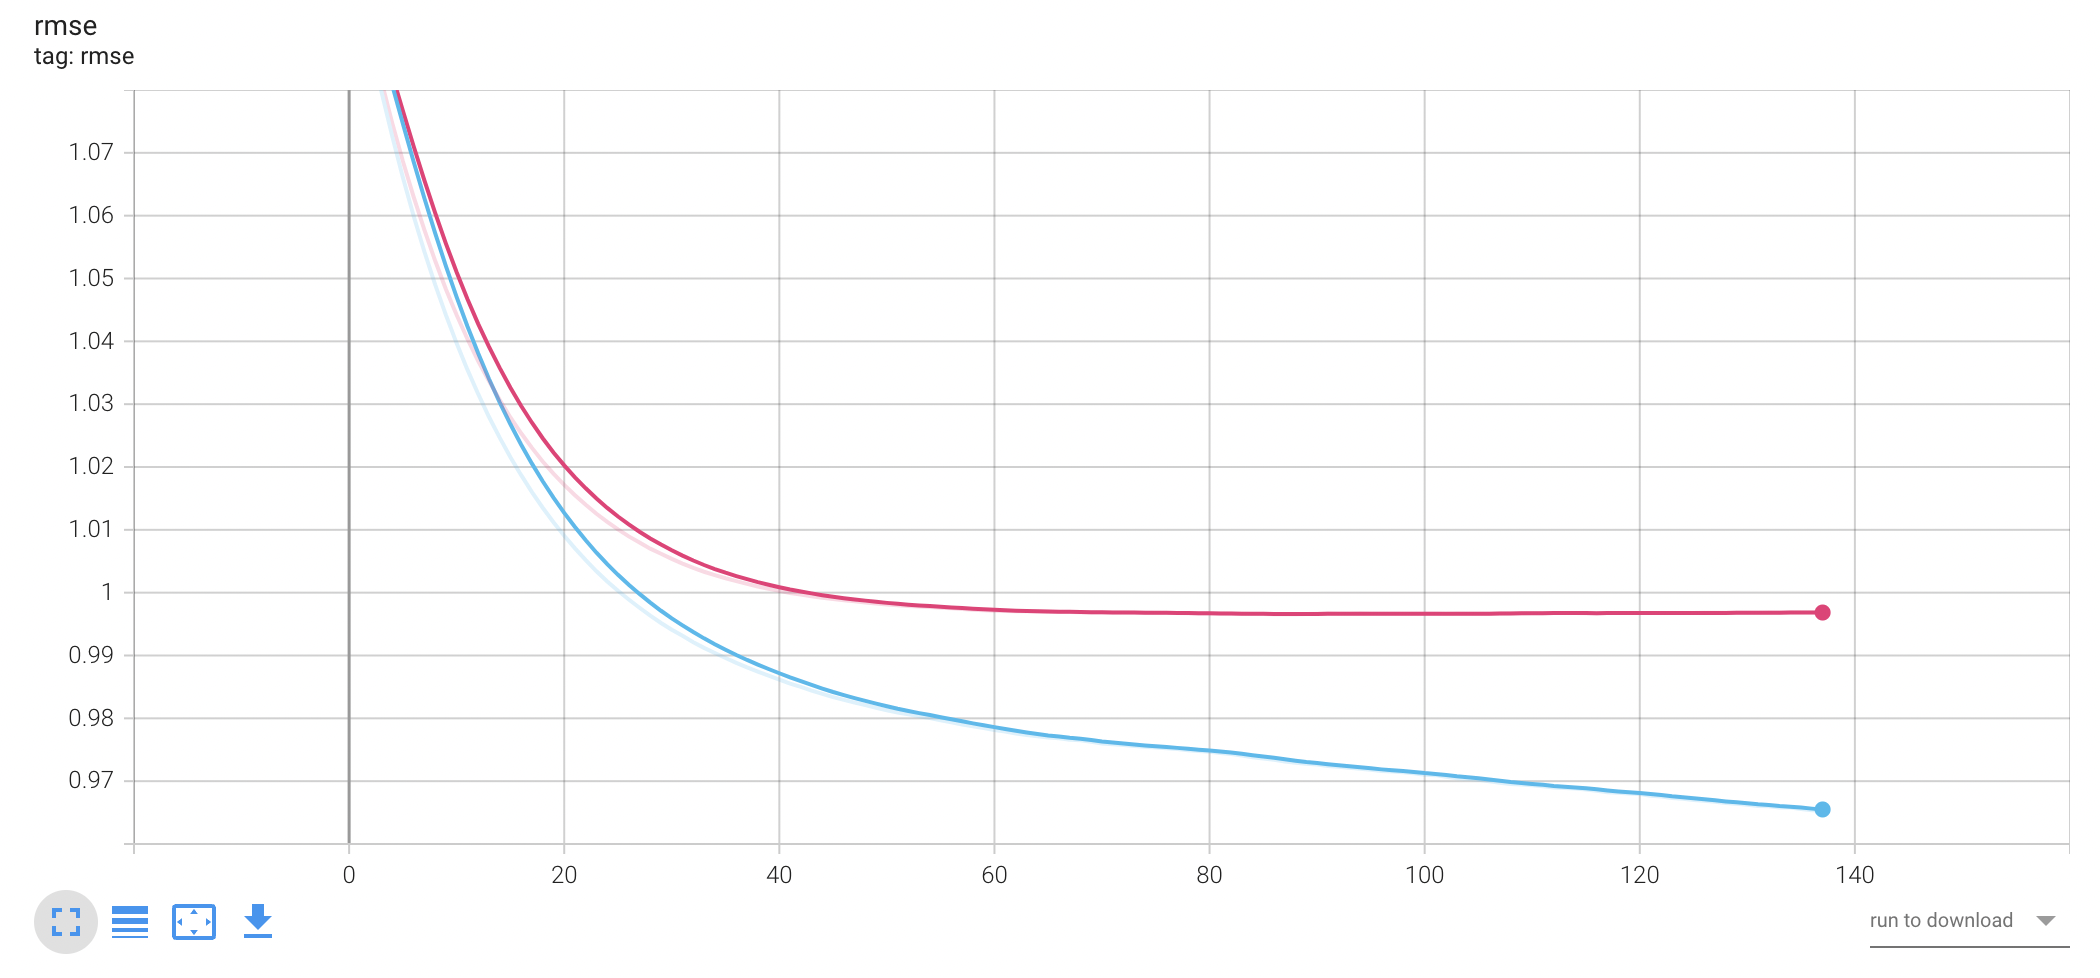
RMSE for each step on training and validation iterations for XGBoost:
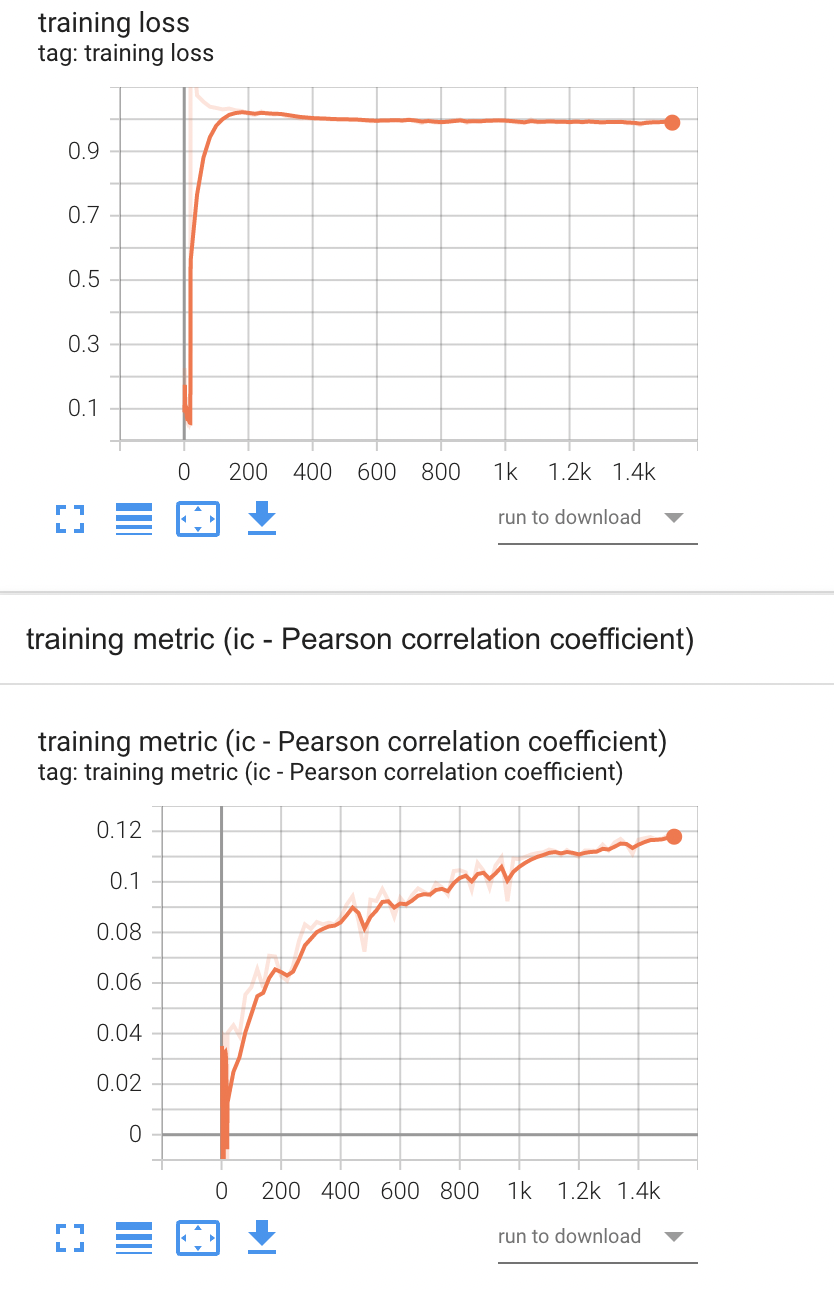
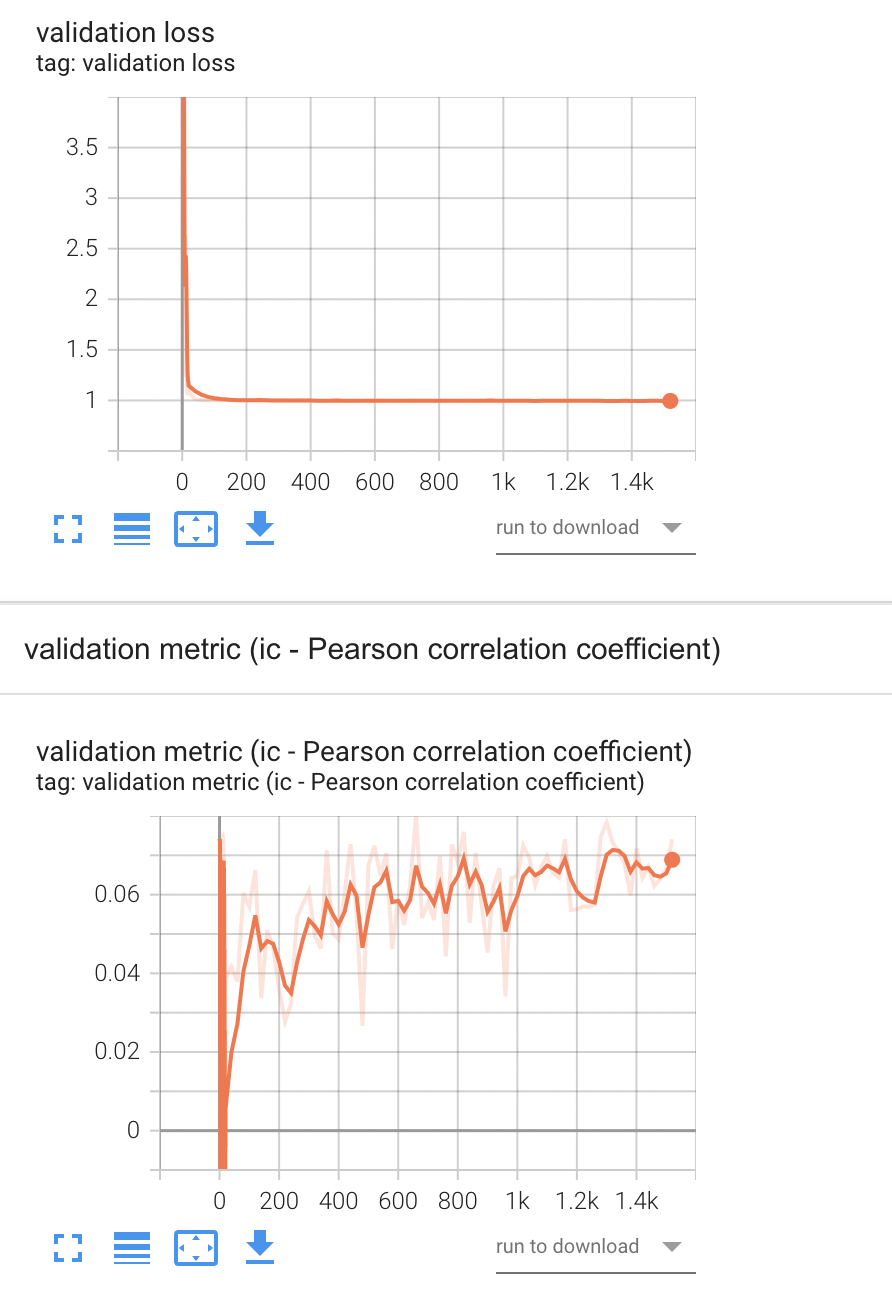
MSE for each step on training and validation iterations for MLP as well as IC (Pearson correlation coefficient):
Types of changes
- [ ] Fix bugs
- [x] Add new feature
- [ ] Update documentation
Sorry for the late response @igor17400 . I added some comments just now.
Besides, please fix the pylint error.
https://github.com/microsoft/qlib/runs/6369431237?check_suite_focus=true#step:7:34
Thanks :)
Thanks @you-n-g for the replies! I'll work on the suggestions and commit the updated code
The main branch has changed a lot (especially the CI). Please merge the main branch. Feel free to contact us if you encountered any problem when fixing the issue.
This PR is stale because it has been open for a year with no activity. Remove the stale label or comment on the PR otherwise this will be closed in 5 days