LightGBM classifier training keeps failed, spark executor exit with code 134 due to unrecognized issue
SynapseML version
0.10.0
System information
- Language version (e.g. python 3.8, scala 2.12): python3
- Spark Version (e.g. 3.2.2): 3.0
- Spark Platform (e.g. Synapse, Databricks): GCP data proc
Describe the problem
Hi team. My LightGBM classifier training job keeps failing due to an unrecognized issue. After checking the full log of yarn application, I can only find the following related message without clear expression on what exactly the error is. Could you please provide me more infos on how to solve this? My dataset is about 4.5 million records with 700 features. And I used 4 GCP n1-highmem-8, with spark executor=4 and executor cores=8 each.
Code to reproduce issue
 train_df = spark.read.parquet(data_path)
 train_df = train_df.select(columns_map['target']+columns_map['feature'])
 train_df = train_df.rdd.map(lambda x: (x[0], Vectors.dense(x[1:]))).toDF(["label", "features"])
 train_df = train_df.withColumn('label', train_df['label'].cast('int'))
 model = LGBClassifierOnSpark(**training_params)
 model.fit(train_df)
Other info / logs
2022-08-16T15:34:26Z][WARNING] Requesting driver to remove executor 2 for reason Container from a bad node: container_e01_1660602949467_0002_01_000004 on host: maglev-aml-cluster-63fdf8-w-1. Exit status: 134. Diagnostics: adoop/yarn/nm-local-dir/usercache/root/appcache/application_1660602949467_0002/container_e01_1660602949467_0002_01_000004/__app__.jar > /var/log/hadoop-yarn/userlogs/application_1660602949467_0002/container_e01_1660602949467_0002_01_000004/stdout 2> /var/log/hadoop-yarn/userlogs/application_1660602949467_0002/container_e01_1660602949467_0002_01_000004/stderr
[2022-08-16T15:34:26Z][WARNING] Lost task 20.0 in stage 3.0 (TID 23) (maglev-aml-cluster-63fdf8-w-2 executor 1): ExecutorLostFailure (executor 1 exited caused by one of the running tasks) Reason: Container from a bad node: container_e01_1660602949467_0002_01_000003 on host: maglev-aml-cluster-63fdf8-w-2. Exit status: 134. Diagnostics: adoop/yarn/nm-local-dir/usercache/root/appcache/application_1660602949467_0002/container_e01_1660602949467_0002_01_000003/__app__.jar > /var/log/hadoop-yarn/userlogs/application_1660602949467_0002/container_e01_1660602949467_0002_01_000003/stdout 2> /var/log/hadoop-yarn/userlogs/application_1660602949467_0002/container_e01_1660602949467_0002_01_000003/stderr
[2022-08-16T15:34:26Z][ERROR] Lost executor 2 on maglev-aml-cluster-63fdf8-w-1: Container from a bad node: container_e01_1660602949467_0002_01_000004 on host: maglev-aml-cluster-63fdf8-w-1. Exit status: 134. Diagnostics: adoop/yarn/nm-local-dir/usercache/root/appcache/application_1660602949467_0002/container_e01_1660602949467_0002_01_000004/__app__.jar > /var/log/hadoop-yarn/userlogs/application_1660602949467_0002/container_e01_1660602949467_0002_01_000004/stdout 2> /var/log/hadoop-yarn/userlogs/application_1660602949467_0002/container_e01_1660602949467_0002_01_000004/stderr
[2022-08-16T15:34:26Z][WARNING] Requesting driver to remove executor 1 for reason Container from a bad node: container_e01_1660602949467_0002_01_000003 on host: maglev-aml-cluster-63fdf8-w-2. Exit status: 134. Diagnostics: adoop/yarn/nm-local-dir/usercache/root/appcache/application_1660602949467_0002/container_e01_1660602949467_0002_01_000003/__app__.jar > /var/log/hadoop-yarn/userlogs/application_1660602949467_0002/container_e01_1660602949467_0002_01_000003/stdout 2> /var/log/hadoop-yarn/userlogs/application_1660602949467_0002/container_e01_1660602949467_0002_01_000003/stderr
[2022-08-16T15:34:26Z][ERROR] Lost executor 1 on maglev-aml-cluster-63fdf8-w-2: Container from a bad node: container_e01_1660602949467_0002_01_000003 on host: maglev-aml-cluster-63fdf8-w-2. Exit status: 134. Diagnostics: adoop/yarn/nm-local-dir/usercache/root/appcache/application_1660602949467_0002/container_e01_1660602949467_0002_01_000003/__app__.jar > /var/log/hadoop-yarn/userlogs/application_1660602949467_0002/container_e01_1660602949467_0002_01_000003/stdout 2> /var/log/hadoop-yarn/userlogs/application_1660602949467_0002/container_e01_1660602949467_0002_01_000003/stderr
[2022-08-16T15:34:26Z][WARNING] Container from a bad node: container_e01_1660602949467_0002_01_000004 on host: maglev-aml-cluster-63fdf8-w-1. Exit status: 134. Diagnostics: adoop/yarn/nm-local-dir/usercache/root/appcache/application_1660602949467_0002/container_e01_1660602949467_0002_01_000004/__app__.jar > /var/log/hadoop-yarn/userlogs/application_1660602949467_0002/container_e01_1660602949467_0002_01_000004/stdout 2> /var/log/hadoop-yarn/userlogs/application_1660602949467_0002/container_e01_1660602949467_0002_01_000004/stderr
[2022-08-16T15:34:26Z][WARNING] Lost task 10.0 in stage 3.0 (TID 13) (maglev-aml-cluster-63fdf8-w-1 executor 2): ExecutorLostFailure (executor 2 exited caused by one of the running tasks) Reason: Container from a bad node: container_e01_1660602949467_0002_01_000004 on host: maglev-aml-cluster-63fdf8-w-1. Exit status: 134. Diagnostics: adoop/yarn/nm-local-dir/usercache/root/appcache/application_1660602949467_0002/container_e01_1660602949467_0002_01_000004/__app__.jar > /var/log/hadoop-yarn/userlogs/application_1660602949467_0002/container_e01_1660602949467_0002_01_000004/stdout 2> /var/log/hadoop-yarn/userlogs/application_1660602949467_0002/container_e01_1660602949467_0002_01_000004/stderr
[2022-08-16T15:34:26Z][WARNING] Container from a bad node: container_e01_1660602949467_0002_01_000003 on host: maglev-aml-cluster-63fdf8-w-2. Exit status: 134. Diagnostics: adoop/yarn/nm-local-dir/usercache/root/appcache/application_1660602949467_0002/container_e01_1660602949467_0002_01_000003/__app__.jar > /var/log/hadoop-yarn/userlogs/application_1660602949467_0002/container_e01_1660602949467_0002_01_000003/stdout 2> /var/log/hadoop-yarn/userlogs/application_1660602949467_0002/container_e01_1660602949467_0002_01_000003/stderr
[2022-08-16T15:34:27Z][WARNING] Requesting driver to remove executor 3 for reason Container from a bad node: container_e01_1660602949467_0002_01_000005 on host: maglev-aml-cluster-63fdf8-w-0. Exit status: 134. Diagnostics: adoop/yarn/nm-local-dir/usercache/root/appcache/application_1660602949467_0002/container_e01_1660602949467_0002_01_000005/__app__.jar > /var/log/hadoop-yarn/userlogs/application_1660602949467_0002/container_e01_1660602949467_0002_01_000005/stdout 2> /var/log/hadoop-yarn/userlogs/application_1660602949467_0002/container_e01_1660602949467_0002_01_000005/stderr
[2022-08-16T15:34:27Z][WARNING] Exception in connection from /10.174.160.243:46852
[2022-08-16T15:34:27Z][ERROR] Lost executor 3 on maglev-aml-cluster-63fdf8-w-0: Container from a bad node: container_e01_1660602949467_0002_01_000005 on host: maglev-aml-cluster-63fdf8-w-0. Exit status: 134. Diagnostics: adoop/yarn/nm-local-dir/usercache/root/appcache/application_1660602949467_0002/container_e01_1660602949467_0002_01_000005/__app__.jar > /var/log/hadoop-yarn/userlogs/application_1660602949467_0002/container_e01_1660602949467_0002_01_000005/stdout 2> /var/log/hadoop-yarn/userlogs/application_1660602949467_0002/container_e01_1660602949467_0002_01_000005/stderr
[2022-08-16T15:34:27Z][WARNING] Lost task 10.1 in stage 3.0 (TID 27) (maglev-aml-cluster-63fdf8-w-0 executor 3): ExecutorLostFailure (executor 3 exited caused by one of the running tasks) Reason: Container from a bad node: container_e01_1660602949467_0002_01_000005 on host: maglev-aml-cluster-63fdf8-w-0. Exit status: 134. Diagnostics: adoop/yarn/nm-local-dir/usercache/root/appcache/application_1660602949467_0002/container_e01_1660602949467_0002_01_000005/__app__.jar > /var/log/hadoop-yarn/userlogs/application_1660602949467_0002/container_e01_1660602949467_0002_01_000005/stdout 2> /var/log/hadoop-yarn/userlogs/application_1660602949467_0002/container_e01_1660602949467_0002_01_000005/stderr
[2022-08-16T15:34:27Z][WARNING] Lost task 21.0 in stage 3.0 (TID 24) (maglev-aml-cluster-63fdf8-w-0 executor 3): ExecutorLostFailure (executor 3 exited caused by one of the running tasks) Reason: Container from a bad node: container_e01_1660602949467_0002_01_000005 on host: maglev-aml-cluster-63fdf8-w-0. Exit status: 134. Diagnostics: adoop/yarn/nm-local-dir/usercache/root/appcache/application_1660602949467_0002/container_e01_1660602949467_0002_01_000005/__app__.jar > /var/log/hadoop-yarn/userlogs/application_1660602949467_0002/container_e01_1660602949467_0002_01_000005/stdout 2> /var/log/hadoop-yarn/userlogs/application_1660602949467_0002/container_e01_1660602949467_0002_01_000005/stderr
[2022-08-16T15:34:27Z][WARNING] Container from a bad node: container_e01_1660602949467_0002_01_000005 on host: maglev-aml-cluster-63fdf8-w-0. Exit status: 134. Diagnostics: adoop/yarn/nm-local-dir/usercache/root/appcache/application_1660602949467_0002/container_e01_1660602949467_0002_01_000005/__app__.jar > /var/log/hadoop-yarn/userlogs/application_1660602949467_0002/container_e01_1660602949467_0002_01_000005/stdout 2> /var/log/hadoop-yarn/userlogs/application_1660602949467_0002/container_e01_1660602949467_0002_01_000005/stderr
[2022-08-16T22:34:26.393079Z][DEFAULT] #
[2022-08-16T22:34:26.393833Z][DEFAULT] # A fatal error has been detected by the Java Runtime Environment:
[2022-08-16T22:34:26.394238Z][DEFAULT] #
[2022-08-16T22:34:26.394513Z][DEFAULT] #  SIGSEGV (0xb) at pc=0x00007fd20ee83a24, pid=5797, tid=0x00007fd1af5c4700
[2022-08-16T22:34:26.394818Z][DEFAULT] #
[2022-08-16T22:34:26.39509Z][DEFAULT] # JRE version: OpenJDK Runtime Environment (8.0_332-b09) (build 1.8.0_332-b09)
[2022-08-16T22:34:26.395351Z][DEFAULT] # Java VM: OpenJDK 64-Bit Server VM (25.332-b09 mixed mode linux-amd64 compressed oops)
[2022-08-16T22:34:26.395576Z][DEFAULT] # Problematic frame:
[2022-08-16T22:34:26.395852Z][DEFAULT] # C  [libc.so.6+0x18ea24]
[2022-08-16T22:34:26.396078Z][DEFAULT] #
[2022-08-16T22:34:26.396328Z][DEFAULT] # Failed to write core dump. Core dumps have been disabled. To enable core dumping, try "ulimit -c unlimited" before starting Java again
[2022-08-16T22:34:26.396549Z][DEFAULT] #
[2022-08-16T22:34:26.396804Z][DEFAULT] # An error report file with more information is saved as:
[2022-08-16T22:34:26.397047Z][DEFAULT] # /mnt/1/hadoop/yarn/nm-local-dir/usercache/root/appcache/application_1660602949467_0002/container_e01_1660602949467_0002_01_000004/hs_err_pid5797.log
[2022-08-16T22:34:26.397258Z][DEFAULT] #
[2022-08-16T22:34:26.397499Z][DEFAULT] # If you would like to submit a bug report, please visit:
[2022-08-16T22:34:26.397731Z][DEFAULT] #   https://github.com/adoptium/adoptium-support/issues
[2022-08-16T22:34:26.397973Z][DEFAULT] # The crash happened outside the Java Virtual Machine in native code.
[2022-08-16T22:34:26.398219Z][DEFAULT] # See problematic frame for where to report the bug.
[2022-08-16T22:34:26.398437Z][DEFAULT] #
[2022-08-16T22:34:26.423668Z][DEFAULT] #
[2022-08-16T22:34:26.424387Z][DEFAULT] # A fatal error has been detected by the Java Runtime Environment:
[2022-08-16T22:34:26.424697Z][DEFAULT] #
[2022-08-16T22:34:26.424947Z][DEFAULT] #  SIGSEGV (0xb) at pc=0x00007f1c2ea55a24, pid=5883, tid=0x00007f1bcf98a700
[2022-08-16T22:34:26.425167Z][DEFAULT] #
[2022-08-16T22:34:26.425436Z][DEFAULT] # JRE version: OpenJDK Runtime Environment (8.0_332-b09) (build 1.8.0_332-b09)
[2022-08-16T22:34:26.42571Z][DEFAULT] # Java VM: OpenJDK 64-Bit Server VM (25.332-b09 mixed mode linux-amd64 compressed oops)
[2022-08-16T22:34:26.425954Z][DEFAULT] # Problematic frame:
[2022-08-16T22:34:26.426168Z][DEFAULT] # C  [libc.so.6+0x18ea24]
[2022-08-16T22:34:26.426393Z][DEFAULT] #
[2022-08-16T22:34:26.426633Z][DEFAULT] # Failed to write core dump. Core dumps have been disabled. To enable core dumping, try "ulimit -c unlimited" before starting Java again
[2022-08-16T22:34:26.426847Z][DEFAULT] #
[2022-08-16T22:34:26.427077Z][DEFAULT] # An error report file with more information is saved as:
[2022-08-16T22:34:26.427326Z][DEFAULT] # /mnt/1/hadoop/yarn/nm-local-dir/usercache/root/appcache/application_1660602949467_0002/container_e01_1660602949467_0002_01_000003/hs_err_pid5883.log
[2022-08-16T22:34:26.427542Z][DEFAULT] #
[2022-08-16T22:34:26.42778Z][DEFAULT] # If you would like to submit a bug report, please visit:
[2022-08-16T22:34:26.428Z][DEFAULT] #   https://github.com/adoptium/adoptium-support/issues
[2022-08-16T22:34:26.428229Z][DEFAULT] # The crash happened outside the Java Virtual Machine in native code.
[2022-08-16T22:34:26.428479Z][DEFAULT] # See problematic frame for where to report the bug.
[2022-08-16T22:34:26.428696Z][DEFAULT] #
[2022-08-16T22:34:49.471098Z][DEFAULT] Traceback (most recent call last):  File "task.py", line 188, in <module>    run_on_spark(task_func, task_func_kwargs, logger, log_level)  File "task.py", line 116, in run_on_spark    task_func(**task_func_kwargs)  File "<string>", line 29, in lightgbm_spark_training  File "/opt/conda/default/lib/python3.8/site-packages/aml/modelhub/lgbm_on_spark.py", line 63, in fit
[2022-08-16T22:34:49.471771Z][DEFAULT]     self.gbm = super(LGBClassifierOnSpark, self).fit(dataset, params=params)
[2022-08-16T22:34:49.472111Z][DEFAULT]   File "/mnt/1/hadoop/yarn/nm-local-dir/usercache/root/appcache/application_1660602949467_0002/container_e01_1660602949467_0002_01_000001/pyspark.zip/pyspark/ml/base.py", line 161, in fit
[2022-08-16T22:34:49.472388Z][DEFAULT]   File "/opt/conda/default/lib/python3.8/site-packages/synapse/ml/lightgbm/LightGBMClassifier.py", line 2017, in _fit
[2022-08-16T22:34:49.47265Z][DEFAULT]     java_model = self._fit_java(dataset)
[2022-08-16T22:34:49.472892Z][DEFAULT]   File "/mnt/1/hadoop/yarn/nm-local-dir/usercache/root/appcache/application_1660602949467_0002/container_e01_1660602949467_0002_01_000001/pyspark.zip/pyspark/ml/wrapper.py", line 332, in _fit_java
[2022-08-16T22:34:49.473129Z][DEFAULT]   File "/mnt/1/hadoop/yarn/nm-local-dir/usercache/root/appcache/application_1660602949467_0002/container_e01_1660602949467_0002_01_000001/py4j-0.10.9-src.zip/py4j/java_gateway.py", line 1304, in __call__
[2022-08-16T22:34:49.473359Z][DEFAULT]   File "/mnt/1/hadoop/yarn/nm-local-dir/usercache/root/appcache/application_1660602949467_0002/container_e01_1660602949467_0002_01_000001/pyspark.zip/pyspark/sql/utils.py", line 111, in deco
[2022-08-16T22:34:49.473608Z][DEFAULT]   File "/mnt/1/hadoop/yarn/nm-local-dir/usercache/root/appcache/application_1660602949467_0002/container_e01_1660602949467_0002_01_000001/py4j-0.10.9-src.zip/py4j/protocol.py", line 326, in get_return_value
[2022-08-16T22:34:49.473919Z][DEFAULT] An error occurred while calling o770.fit.
[2022-08-16T22:34:49.474733Z][DEFAULT] : org.apache.spark.SparkException: Job aborted due to stage failure: Task 10 in stage 3.0 failed 4 times, most recent failure: Lost task 10.3 in stage 3.0 (TID 31) (maglev-aml-cluster-63fdf8-w-2 executor 6): java.net.ConnectException: Connection refused (Connection refused)	at java.net.PlainSocketImpl.socketConnect(Native Method)	at java.net.AbstractPlainSocketImpl.doConnect(AbstractPlainSocketImpl.java:350)	at java.net.AbstractPlainSocketImpl.connectToAddress(AbstractPlainSocketImpl.java:206)	at java.net.AbstractPlainSocketImpl.connect(AbstractPlainSocketImpl.java:188)	at java.net.SocksSocketImpl.connect(SocksSocketImpl.java:392)	at java.net.Socket.connect(Socket.java:607)	at java.net.Socket.connect(Socket.java:556)	at java.net.Socket.<init>(Socket.java:452)	at java.net.Socket.<init>(Socket.java:229)	at com.microsoft.azure.synapse.ml.lightgbm.NetworkManager$.getNetworkTopologyInfoFromDriver(NetworkManager.scala:129)	at com.microsoft.azure.synapse.ml.lightgbm.NetworkManager$.$anonfun$getGlobalNetworkInfo$2(NetworkManager.scala:116)	at com.microsoft.azure.synapse.ml.core.utils.FaultToleranceUtils$.retryWithTimeout(FaultToleranceUtils.scala:24)	at com.microsoft.azure.synapse.ml.core.utils.FaultToleranceUtils$.retryWithTimeout(FaultToleranceUtils.scala:29)	at com.microsoft.azure.synapse.ml.core.utils.FaultToleranceUtils$.retryWithTimeout(FaultToleranceUtils.scala:29)	at com.microsoft.azure.synapse.ml.core.utils.FaultToleranceUtils$.retryWithTimeout(FaultToleranceUtils.scala:29)	at com.microsoft.azure.synapse.ml.core.utils.FaultToleranceUtils$.retryWithTimeout(FaultToleranceUtils.scala:29)	at com.microsoft.azure.synapse.ml.lightgbm.NetworkManager$.$anonfun$getGlobalNetworkInfo$1(NetworkManager.scala:111)	at com.microsoft.azure.synapse.ml.core.env.StreamUtilities$.using(StreamUtilities.scala:28)	at com.microsoft.azure.synapse.ml.lightgbm.NetworkManager$.getGlobalNetworkInfo(NetworkManager.scala:107)	at com.microsoft.azure.synapse.ml.lightgbm.BasePartitionTask.initialize(BasePartitionTask.scala:179)	at com.microsoft.azure.synapse.ml.lightgbm.BasePartitionTask.mapPartitionTask(BasePartitionTask.scala:114)	at com.microsoft.azure.synapse.ml.lightgbm.LightGBMBase.$anonfun$executePartitionTasks$1(LightGBMBase.scala:589)	at org.apache.spark.sql.execution.MapPartitionsExec.$anonfun$doExecute$3(objects.scala:195)	at org.apache.spark.rdd.RDD.$anonfun$mapPartitionsInternal$2(RDD.scala:898)	at org.apache.spark.rdd.RDD.$anonfun$mapPartitionsInternal$2$adapted(RDD.scala:898)	at org.apache.spark.rdd.MapPartitionsRDD.compute(MapPartitionsRDD.scala:52)	at org.apache.spark.rdd.RDD.computeOrReadCheckpoint(RDD.scala:373)	at org.apache.spark.rdd.RDD.iterator(RDD.scala:337)	at org.apache.spark.rdd.MapPartitionsRDD.compute(MapPartitionsRDD.scala:52)	at org.apache.spark.rdd.RDD.computeOrReadCheckpoint(RDD.scala:373)	at org.apache.spark.rdd.RDD.iterator(RDD.scala:337)	at org.apache.spark.rdd.MapPartitionsRDD.compute(MapPartitionsRDD.scala:52)	at org.apache.spark.rdd.RDD.computeOrReadCheckpoint(RDD.scala:373)	at org.apache.spark.rdd.RDD.iterator(RDD.scala:337)	at org.apache.spark.scheduler.ResultTask.runTask(ResultTask.scala:90)	at org.apache.spark.scheduler.Task.run(Task.scala:131)	at org.apache.spark.executor.Executor$TaskRunner.$anonfun$run$3(Executor.scala:498)	at org.apache.spark.util.Utils$.tryWithSafeFinally(Utils.scala:1439)	at org.apache.spark.executor.Executor$TaskRunner.run(Executor.scala:501)	at java.util.concurrent.ThreadPoolExecutor.runWorker(ThreadPoolExecutor.java:1149)	at java.util.concurrent.ThreadPoolExecutor$Worker.run(ThreadPoolExecutor.java:624)	at java.lang.Thread.run(Thread.java:750)
[2022-08-16T22:34:49.475027Z][DEFAULT] None
[2022-08-16T22:34:49.475263Z][DEFAULT] Driver stacktrace:
[2022-08-16T22:34:49.475493Z][DEFAULT] 	at org.apache.spark.scheduler.DAGScheduler.failJobAndIndependentStages(DAGScheduler.scala:2304)
[2022-08-16T22:34:49.475729Z][DEFAULT] 	at org.apache.spark.scheduler.DAGScheduler.$anonfun$abortStage$2(DAGScheduler.scala:2253)
[2022-08-16T22:34:49.475955Z][DEFAULT] 	at org.apache.spark.scheduler.DAGScheduler.$anonfun$abortStage$2$adapted(DAGScheduler.scala:2252)
[2022-08-16T22:34:49.476171Z][DEFAULT] 	at scala.collection.mutable.ResizableArray.foreach(ResizableArray.scala:62)
[2022-08-16T22:34:49.476416Z][DEFAULT] 	at scala.collection.mutable.ResizableArray.foreach$(ResizableArray.scala:55)
[2022-08-16T22:34:49.476672Z][DEFAULT] 	at scala.collection.mutable.ArrayBuffer.foreach(ArrayBuffer.scala:49)
[2022-08-16T22:34:49.476894Z][DEFAULT] 	at org.apache.spark.scheduler.DAGScheduler.abortStage(DAGScheduler.scala:2252)
[2022-08-16T22:34:49.477118Z][DEFAULT] 	at org.apache.spark.scheduler.DAGScheduler.$anonfun$handleTaskSetFailed$1(DAGScheduler.scala:1124)
[2022-08-16T22:34:49.477364Z][DEFAULT] 	at org.apache.spark.scheduler.DAGScheduler.$anonfun$handleTaskSetFailed$1$adapted(DAGScheduler.scala:1124)
[2022-08-16T22:34:49.477597Z][DEFAULT] 	at scala.Option.foreach(Option.scala:407)
[2022-08-16T22:34:49.47782Z][DEFAULT] 	at org.apache.spark.scheduler.DAGScheduler.handleTaskSetFailed(DAGScheduler.scala:1124)
[2022-08-16T22:34:49.478043Z][DEFAULT] 	at org.apache.spark.scheduler.DAGSchedulerEventProcessLoop.doOnReceive(DAGScheduler.scala:2491)
[2022-08-16T22:34:49.478261Z][DEFAULT] 	at org.apache.spark.scheduler.DAGSchedulerEventProcessLoop.onReceive(DAGScheduler.scala:2433)
[2022-08-16T22:34:49.47848Z][DEFAULT] 	at org.apache.spark.scheduler.DAGSchedulerEventProcessLoop.onReceive(DAGScheduler.scala:2422)
[2022-08-16T22:34:49.478716Z][DEFAULT] 	at org.apache.spark.util.EventLoop$$anon$1.run(EventLoop.scala:49)
[2022-08-16T22:34:49.478939Z][DEFAULT] 	at org.apache.spark.scheduler.DAGScheduler.runJob(DAGScheduler.scala:902)
[2022-08-16T22:34:49.479153Z][DEFAULT] 	at org.apache.spark.SparkContext.runJob(SparkContext.scala:2204)
[2022-08-16T22:34:49.479372Z][DEFAULT] 	at org.apache.spark.SparkContext.runJob(SparkContext.scala:2225)
[2022-08-16T22:34:49.479603Z][DEFAULT] 	at org.apache.spark.SparkContext.runJob(SparkContext.scala:2244)
[2022-08-16T22:34:49.479838Z][DEFAULT] 	at org.apache.spark.SparkContext.runJob(SparkContext.scala:2269)
[2022-08-16T22:34:49.480063Z][DEFAULT] 	at org.apache.spark.rdd.RDD.$anonfun$collect$1(RDD.scala:1030)
[2022-08-16T22:34:49.480284Z][DEFAULT] 	at org.apache.spark.rdd.RDDOperationScope$.withScope(RDDOperationScope.scala:151)
[2022-08-16T22:34:49.480545Z][DEFAULT] 	at org.apache.spark.rdd.RDDOperationScope$.withScope(RDDOperationScope.scala:112)
[2022-08-16T22:34:49.480776Z][DEFAULT] 	at org.apache.spark.rdd.RDD.withScope(RDD.scala:414)
[2022-08-16T22:34:49.480995Z][DEFAULT] 	at org.apache.spark.rdd.RDD.collect(RDD.scala:1029)
[2022-08-16T22:34:49.481216Z][DEFAULT] 	at org.apache.spark.sql.execution.SparkPlan.executeCollect(SparkPlan.scala:390)
[2022-08-16T22:34:49.481436Z][DEFAULT] 	at org.apache.spark.sql.Dataset.collectFromPlan(Dataset.scala:3709)
[2022-08-16T22:34:49.481672Z][DEFAULT] 	at org.apache.spark.sql.Dataset.$anonfun$collect$1(Dataset.scala:2978)
[2022-08-16T22:34:49.481944Z][DEFAULT] 	at org.apache.spark.sql.Dataset.$anonfun$withAction$1(Dataset.scala:3700)
[2022-08-16T22:34:49.482195Z][DEFAULT] 	at org.apache.spark.sql.execution.SQLExecution$.$anonfun$withNewExecutionId$5(SQLExecution.scala:103)
[2022-08-16T22:34:49.482432Z][DEFAULT] 	at org.apache.spark.sql.execution.SQLExecution$.withSQLConfPropagated(SQLExecution.scala:163)
[2022-08-16T22:34:49.482675Z][DEFAULT] 	at org.apache.spark.sql.execution.SQLExecution$.$anonfun$withNewExecutionId$1(SQLExecution.scala:90)
[2022-08-16T22:34:49.482895Z][DEFAULT] 	at org.apache.spark.sql.SparkSession.withActive(SparkSession.scala:775)
[2022-08-16T22:34:49.483132Z][DEFAULT] 	at org.apache.spark.sql.execution.SQLExecution$.withNewExecutionId(SQLExecution.scala:64)
[2022-08-16T22:34:49.483351Z][DEFAULT] 	at org.apache.spark.sql.Dataset.withAction(Dataset.scala:3698)
[2022-08-16T22:34:49.483576Z][DEFAULT] 	at org.apache.spark.sql.Dataset.collect(Dataset.scala:2978)
[2022-08-16T22:34:49.4838Z][DEFAULT] 	at com.microsoft.azure.synapse.ml.lightgbm.LightGBMBase.executePartitionTasks(LightGBMBase.scala:597)
[2022-08-16T22:34:49.484127Z][DEFAULT] 	at com.microsoft.azure.synapse.ml.lightgbm.LightGBMBase.executePartitionTasks$(LightGBMBase.scala:583)
[2022-08-16T22:34:49.484415Z][DEFAULT] 	at com.microsoft.azure.synapse.ml.lightgbm.LightGBMClassifier.executePartitionTasks(LightGBMClassifier.scala:27)
[2022-08-16T22:34:49.48467Z][DEFAULT] 	at com.microsoft.azure.synapse.ml.lightgbm.LightGBMBase.executeTraining(LightGBMBase.scala:573)
[2022-08-16T22:34:49.484898Z][DEFAULT] 	at com.microsoft.azure.synapse.ml.lightgbm.LightGBMBase.executeTraining$(LightGBMBase.scala:545)
[2022-08-16T22:34:49.485133Z][DEFAULT] 	at com.microsoft.azure.synapse.ml.lightgbm.LightGBMClassifier.executeTraining(LightGBMClassifier.scala:27)
[2022-08-16T22:34:49.485359Z][DEFAULT] 	at com.microsoft.azure.synapse.ml.lightgbm.LightGBMBase.trainOneDataBatch(LightGBMBase.scala:435)
[2022-08-16T22:34:49.485591Z][DEFAULT] 	at com.microsoft.azure.synapse.ml.lightgbm.LightGBMBase.trainOneDataBatch$(LightGBMBase.scala:392)
[2022-08-16T22:34:49.485819Z][DEFAULT] 	at com.microsoft.azure.synapse.ml.lightgbm.LightGBMClassifier.trainOneDataBatch(LightGBMClassifier.scala:27)
[2022-08-16T22:34:49.486039Z][DEFAULT] 	at com.microsoft.azure.synapse.ml.lightgbm.LightGBMBase.$anonfun$train$2(LightGBMBase.scala:61)
[2022-08-16T22:34:49.486258Z][DEFAULT] 	at com.microsoft.azure.synapse.ml.logging.BasicLogging.logVerb(BasicLogging.scala:62)
[2022-08-16T22:34:49.48648Z][DEFAULT] 	at com.microsoft.azure.synapse.ml.logging.BasicLogging.logVerb$(BasicLogging.scala:59)
[2022-08-16T22:34:49.486719Z][DEFAULT] 	at com.microsoft.azure.synapse.ml.lightgbm.LightGBMClassifier.logVerb(LightGBMClassifier.scala:27)
[2022-08-16T22:34:49.486938Z][DEFAULT] 	at com.microsoft.azure.synapse.ml.logging.BasicLogging.logTrain(BasicLogging.scala:48)
[2022-08-16T22:34:49.487158Z][DEFAULT] 	at com.microsoft.azure.synapse.ml.logging.BasicLogging.logTrain$(BasicLogging.scala:47)
[2022-08-16T22:34:49.487396Z][DEFAULT] 	at com.microsoft.azure.synapse.ml.lightgbm.LightGBMClassifier.logTrain(LightGBMClassifier.scala:27)
[2022-08-16T22:34:49.487631Z][DEFAULT] 	at com.microsoft.azure.synapse.ml.lightgbm.LightGBMBase.train(LightGBMBase.scala:42)
[2022-08-16T22:34:49.487851Z][DEFAULT] 	at com.microsoft.azure.synapse.ml.lightgbm.LightGBMBase.train$(LightGBMBase.scala:35)
[2022-08-16T22:34:49.48807Z][DEFAULT] 	at com.microsoft.azure.synapse.ml.lightgbm.LightGBMClassifier.train(LightGBMClassifier.scala:27)
[2022-08-16T22:34:49.48829Z][DEFAULT] 	at com.microsoft.azure.synapse.ml.lightgbm.LightGBMClassifier.train(LightGBMClassifier.scala:27)
[2022-08-16T22:34:49.488547Z][DEFAULT] 	at org.apache.spark.ml.Predictor.fit(Predictor.scala:151)
[2022-08-16T22:34:49.488769Z][DEFAULT] 	at sun.reflect.NativeMethodAccessorImpl.invoke0(Native Method)
[2022-08-16T22:34:49.488988Z][DEFAULT] 	at sun.reflect.NativeMethodAccessorImpl.invoke(NativeMethodAccessorImpl.java:62)
[2022-08-16T22:34:49.489207Z][DEFAULT] 	at sun.reflect.DelegatingMethodAccessorImpl.invoke(DelegatingMethodAccessorImpl.java:43)
[2022-08-16T22:34:49.48949Z][DEFAULT] 	at java.lang.reflect.Method.invoke(Method.java:498)
[2022-08-16T22:34:49.489738Z][DEFAULT] 	at py4j.reflection.MethodInvoker.invoke(MethodInvoker.java:244)
[2022-08-16T22:34:49.489974Z][DEFAULT] 	at py4j.reflection.ReflectionEngine.invoke(ReflectionEngine.java:357)
[2022-08-16T22:34:49.490194Z][DEFAULT] 	at py4j.Gateway.invoke(Gateway.java:282)
[2022-08-16T22:34:49.490411Z][DEFAULT] 	at py4j.commands.AbstractCommand.invokeMethod(AbstractCommand.java:132)
[2022-08-16T22:34:49.490643Z][DEFAULT] 	at py4j.commands.CallCommand.execute(CallCommand.java:79)
[2022-08-16T22:34:49.49086Z][DEFAULT] 	at py4j.GatewayConnection.run(GatewayConnection.java:238)
[2022-08-16T22:34:49.491076Z][DEFAULT] 	at java.lang.Thread.run(Thread.java:750)
[2022-08-16T22:34:49.491759Z][DEFAULT] Caused by: java.net.ConnectException: Connection refused (Connection refused)	at java.net.PlainSocketImpl.socketConnect(Native Method)	at java.net.AbstractPlainSocketImpl.doConnect(AbstractPlainSocketImpl.java:350)	at java.net.AbstractPlainSocketImpl.connectToAddress(AbstractPlainSocketImpl.java:206)	at java.net.AbstractPlainSocketImpl.connect(AbstractPlainSocketImpl.java:188)	at java.net.SocksSocketImpl.connect(SocksSocketImpl.java:392)	at java.net.Socket.connect(Socket.java:607)	at java.net.Socket.connect(Socket.java:556)	at java.net.Socket.<init>(Socket.java:452)	at java.net.Socket.<init>(Socket.java:229)	at com.microsoft.azure.synapse.ml.lightgbm.NetworkManager$.getNetworkTopologyInfoFromDriver(NetworkManager.scala:129)	at com.microsoft.azure.synapse.ml.lightgbm.NetworkManager$.$anonfun$getGlobalNetworkInfo$2(NetworkManager.scala:116)	at com.microsoft.azure.synapse.ml.core.utils.FaultToleranceUtils$.retryWithTimeout(FaultToleranceUtils.scala:24)	at com.microsoft.azure.synapse.ml.core.utils.FaultToleranceUtils$.retryWithTimeout(FaultToleranceUtils.scala:29)	at com.microsoft.azure.synapse.ml.core.utils.FaultToleranceUtils$.retryWithTimeout(FaultToleranceUtils.scala:29)	at com.microsoft.azure.synapse.ml.core.utils.FaultToleranceUtils$.retryWithTimeout(FaultToleranceUtils.scala:29)	at com.microsoft.azure.synapse.ml.core.utils.FaultToleranceUtils$.retryWithTimeout(FaultToleranceUtils.scala:29)	at com.microsoft.azure.synapse.ml.lightgbm.NetworkManager$.$anonfun$getGlobalNetworkInfo$1(NetworkManager.scala:111)	at com.microsoft.azure.synapse.ml.core.env.StreamUtilities$.using(StreamUtilities.scala:28)	at com.microsoft.azure.synapse.ml.lightgbm.NetworkManager$.getGlobalNetworkInfo(NetworkManager.scala:107)	at com.microsoft.azure.synapse.ml.lightgbm.BasePartitionTask.initialize(BasePartitionTask.scala:179)	at com.microsoft.azure.synapse.ml.lightgbm.BasePartitionTask.mapPartitionTask(BasePartitionTask.scala:114)	at com.microsoft.azure.synapse.ml.lightgbm.LightGBMBase.$anonfun$executePartitionTasks$1(LightGBMBase.scala:589)	at org.apache.spark.sql.execution.MapPartitionsExec.$anonfun$doExecute$3(objects.scala:195)	at org.apache.spark.rdd.RDD.$anonfun$mapPartitionsInternal$2(RDD.scala:898)	at org.apache.spark.rdd.RDD.$anonfun$mapPartitionsInternal$2$adapted(RDD.scala:898)	at org.apache.spark.rdd.MapPartitionsRDD.compute(MapPartitionsRDD.scala:52)	at org.apache.spark.rdd.RDD.computeOrReadCheckpoint(RDD.scala:373)	at org.apache.spark.rdd.RDD.iterator(RDD.scala:337)	at org.apache.spark.rdd.MapPartitionsRDD.compute(MapPartitionsRDD.scala:52)	at org.apache.spark.rdd.RDD.computeOrReadCheckpoint(RDD.scala:373)	at org.apache.spark.rdd.RDD.iterator(RDD.scala:337)	at org.apache.spark.rdd.MapPartitionsRDD.compute(MapPartitionsRDD.scala:52)	at org.apache.spark.rdd.RDD.computeOrReadCheckpoint(RDD.scala:373)	at org.apache.spark.rdd.RDD.iterator(RDD.scala:337)	at org.apache.spark.scheduler.ResultTask.runTask(ResultTask.scala:90)	at org.apache.spark.scheduler.Task.run(Task.scala:131)	at org.apache.spark.executor.Executor$TaskRunner.$anonfun$run$3(Executor.scala:498)	at org.apache.spark.util.Utils$.tryWithSafeFinally(Utils.scala:1439)	at org.apache.spark.executor.Executor$TaskRunner.run(Executor.scala:501)	at java.util.concurrent.ThreadPoolExecutor.runWorker(ThreadPoolExecutor.java:1149)	at java.util.concurrent.ThreadPoolExecutor$Worker.run(ThreadPoolExecutor.java:624)	... 1 more
What component(s) does this bug affect?
- [ ]
area/cognitive: Cognitive project - [ ]
area/core: Core project - [ ]
area/deep-learning: DeepLearning project - [X]
area/lightgbm: Lightgbm project - [ ]
area/opencv: Opencv project - [ ]
area/vw: VW project - [ ]
area/website: Website - [ ]
area/build: Project build system - [ ]
area/notebooks: Samples under notebooks folder - [ ]
area/docker: Docker usage - [ ]
area/models: models related issue
What language(s) does this bug affect?
- [ ]
language/scala: Scala source code - [X]
language/python: Pyspark APIs - [ ]
language/r: R APIs - [ ]
language/csharp: .NET APIs - [ ]
language/new: Proposals for new client languages
What integration(s) does this bug affect?
- [X]
integrations/synapse: Azure Synapse integrations - [ ]
integrations/azureml: Azure ML integrations - [ ]
integrations/databricks: Databricks integrations
AB#1936447
Hey @Jidong0726 :wave:! Thank you so much for reporting the issue/feature request :rotating_light:. Someone from SynapseML Team will be looking to triage this issue soon. We appreciate your patience.
apologies for the delay, I didn't get a tag notification. There's nothing that I can see from the logs that indicates what the problem is. It's possible it's just a OOM error that crashes the JVM in the native layer. Can you try with fewer number of rows? We are working on a new smaller memory footprint for training, but it's not yet available.
Hi @svotaw really appreciated for your reply. Actually those are all the relative log that I can get from my executors lol. I'm not sure about whether it's an OOM cuz our spark cluster and config is large enough for this dataset. We've also done some experiments to use this cluster to run a much large data size which works fine. In addition I checked that error code 137 indicates the OOM issue while 134 means 'bad container', which we are not sure about the exact meaning.
We also encountered this problem. our dataset is 60G executors: 128 memory: 16G executor cores: 4 Is there any good solution now?
We are close to having a new execution engine, just waiting on a bug fix review from LightGBM. I can update this thread when it is available. With the error as is, there's not much I can diagnose about a crash in the native linux layer.
hello, @svotaw I solved the problem with this parameter useBarrierExecutionMode=True . But it confuses me even more.
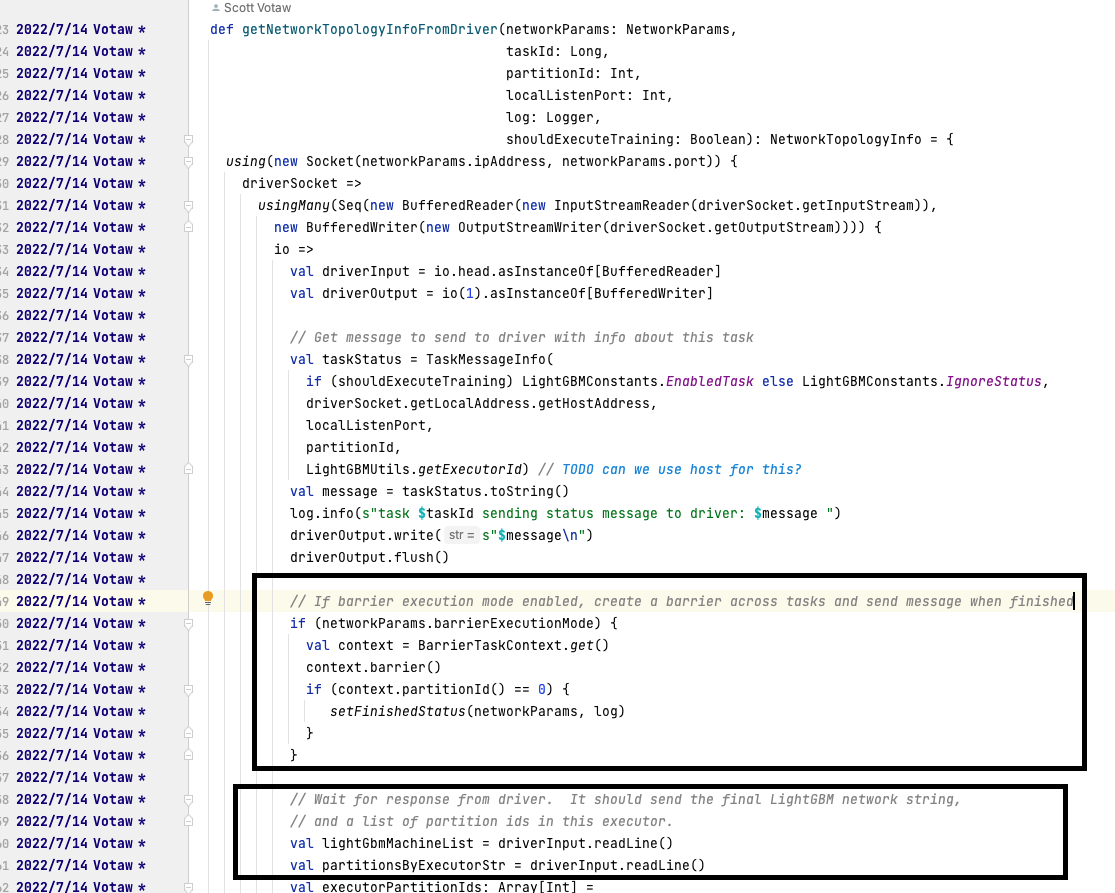 I looked at where the barrier works and can see why it can wait until all nodes succeed and get the correct topology, but I don't understand why it would be wrong without the barrier. can you help me with this question?
These questions are related,748,594,743, but I have never found the exact reason.
I can't see why it would be different either just looking at the code, although @imatiach-msft might have more context for the errors he was seeing without it and why he added it. I have mostly worked on new code soon to be released which does not use barrier execution mode.
Have you tried the latest release? I know there were some fixes that went into 0.10.1 and after.
The version we are using now is the latest version. 0.10.1 . and thx for your reply. hello, @imatiach-msft ,Can you help me why this problem occurs?
 I think I found the root cause code of this error, @svotaw @imatiach-msft . if the number of tasks requested is inconsistent with the number of tasks allocated. There is currently an infinite loop of logic without the Barrier model.
Therefore, If not use Barrier Execution Mode, this error will occurs frequently when the cluster resources are tight, and disappears when the resources are sufficient.
Thanks again for your reply.
I think I found the root cause code of this error, @svotaw @imatiach-msft . if the number of tasks requested is inconsistent with the number of tasks allocated. There is currently an infinite loop of logic without the Barrier model.
Therefore, If not use Barrier Execution Mode, this error will occurs frequently when the cluster resources are tight, and disappears when the resources are sufficient.
Thanks again for your reply.
Maybe there can have a strategy here to skip the check logic and set numTasks to the number of workers obtained.: strategy: when a certain ratio of workers are connected & Wait 5 minutes and still no new worker joins Then let the developer can set this ratio. This will allow users to run normally outside of Barrier mode.
Thanks for your investigation! I'm not sure how numTasks could be different than the number of Tasks allocated. For non-barrier mode, we specifically coalesce the number of partitions to the number of desired tasks, and Spark should allocate 1 Task/partition. Can you explain how you think numTasks could not match the actual number of Tasks? (note that due to the way LightGBM algorithm is designed, all tasks must run in parallel, not staggered, which is why we reduce the number of partitions if it's too many to be run on the executors all at once).

It IS curious why barrier mode works and non-barrier mode doesn't. That seems like a very interesting finding. How are you setting the number of tasks (or are you)? Can you tell how many tasks get created? Can you try explicitly setting the number of tasks to the number of executors (or some other smaller number)?
Sorry for reply so late. In fact I am not sure why numTasks not match the actual number of Tasks.While the driver is waiting for accept, will a task failure cause this problem? i don't know. and I tried several times, but it didn't reproduce(This may be because I reduced the number of taskNumbers to 128 when retrying). my taskNumber is not automatically assigned, it is set by param. the config encounters the problem before : dataset : 60G executors: 128 memory: 16G executor cores: 4 numTasks: 512
Even when my numTasks number is 512, it runs successfully most of the case.
I think I reproduced the problem. without Barrier Execution Mode. dataset : 40G executors: 64 memory: 16G executor cores: 2 numTasks: 128
I have checked all the 128 tasks log . they all end with : 22/11/21 13:14:55 INFO BulkPartitionTask: task 12488 sending status message to driver: ignore:xxxxxxx:12459:75:29 .

As can be seen from the driverlog, the driver has been waiting for a node A, driver log:
I counted all the information connected to the node on the driver, and found that node A is indeed missing.

node A log: But In fact, this node has already sent the connection information.

So a deadlock occurs.
The abnormal executor ID i 65.And It can be seen from the job graph that it be caused by a node 14 removed in the middle and restarting a new node 65. And the new node cannot connect to driver.
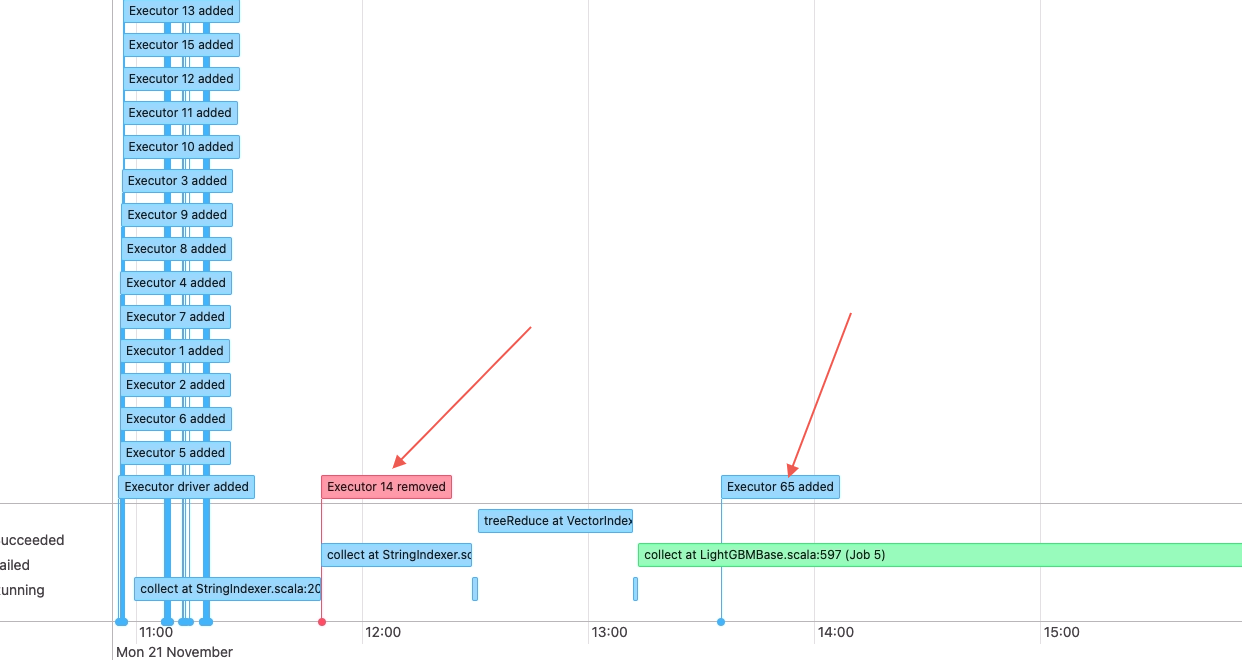
thanks so much for this great investigation! I will take a look in more detail soon at what you sent.
I started looking at it, and basically this is just a limitation of using LightGBM in a Spark context. We use LightGBM in "distributed" mode, which requires all nodes to be working at the same time to be processing the data (i.e., no time parallelism). Spark, however, is designed to be resilient, and just restart any executors that it wants to (due to error, unresponsiveness, scaling, etc.). So if Spark decides to restart an executor once we've already started, it will basically break LightGBM. Our SynapseML wrapper also works this way since it integrates with Spark.
However, I'm going to investigate this and see if there's anything we (SyanpseML) can do to mitigate when this happens, particularly at the preparation stage. Maybe we can recover if we haven't reached the training stage yet.
I will work on it as I can, but we just got our new execution engine code checked into the native LightGBM side today, and will be working to release it through SyanpseML. It saves an order magnitude of memory, so we're hoping that it will improve LightGBM excecution dramatically in SynapseML. As I'm free on the side, I will see if we can't also improve recovery for the scenario you posted above.
Hello - just want to check in and see the status of this solution. Im also running into the issue where LightGBM collect stalls, most likely due to executors scaling up within our Spark context. Was there a fix that was pushed for this issue or alternative path forward to take?
Also - where in the source code would you recommend I look at to also brainstorm a solution for this in the meantime? I would love to help contribute to this project
A solution for dynamic scaling in LightGBM? This would be LightGBM code, so microsoft/LightGBM. We (SynapseML) just generally recommend to turn off dynamic executor scaling for LightGBM usage. I will be looking into a shorter term solution in the next couple of weeks to at least see if we can fail fast when network initialization fails.