SandDance

SandDance copied to clipboard
Trendline to better understand data distribution
I have a scatterplot of randomly sampled algorithm configurations:
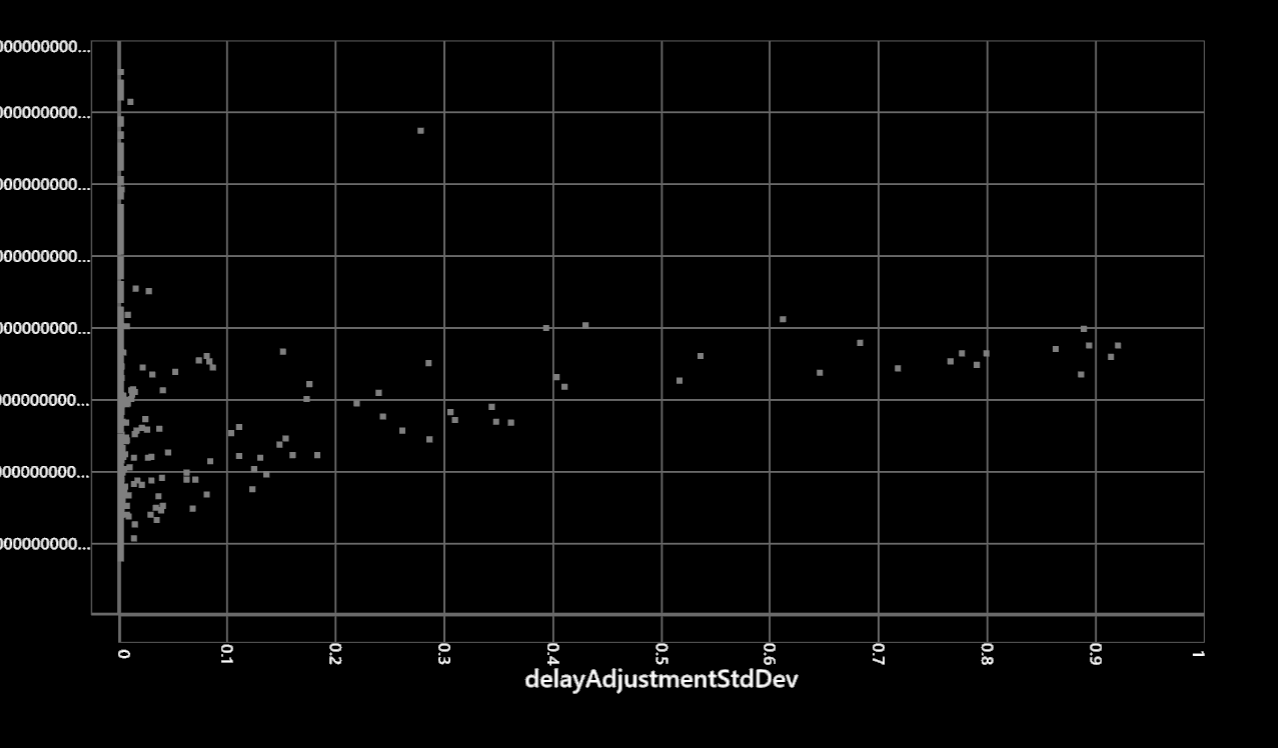
It's difficult to see what happens with all the closely aligned points at the left. To better understand where the optimum lies, I'd like to have the ability to add a trendline (2nd degree polynomial function).