X axis (or Y depending on chart type) does not generate proper bins (empty bins)
I have a CSV dataset with 4 class values (2001, 2002, 2003 and 2004) with their respective values so it naturally should be grupped in 4 unique bins, and within the bins classified by values. The problem is that is creates empty (duplicated) bins
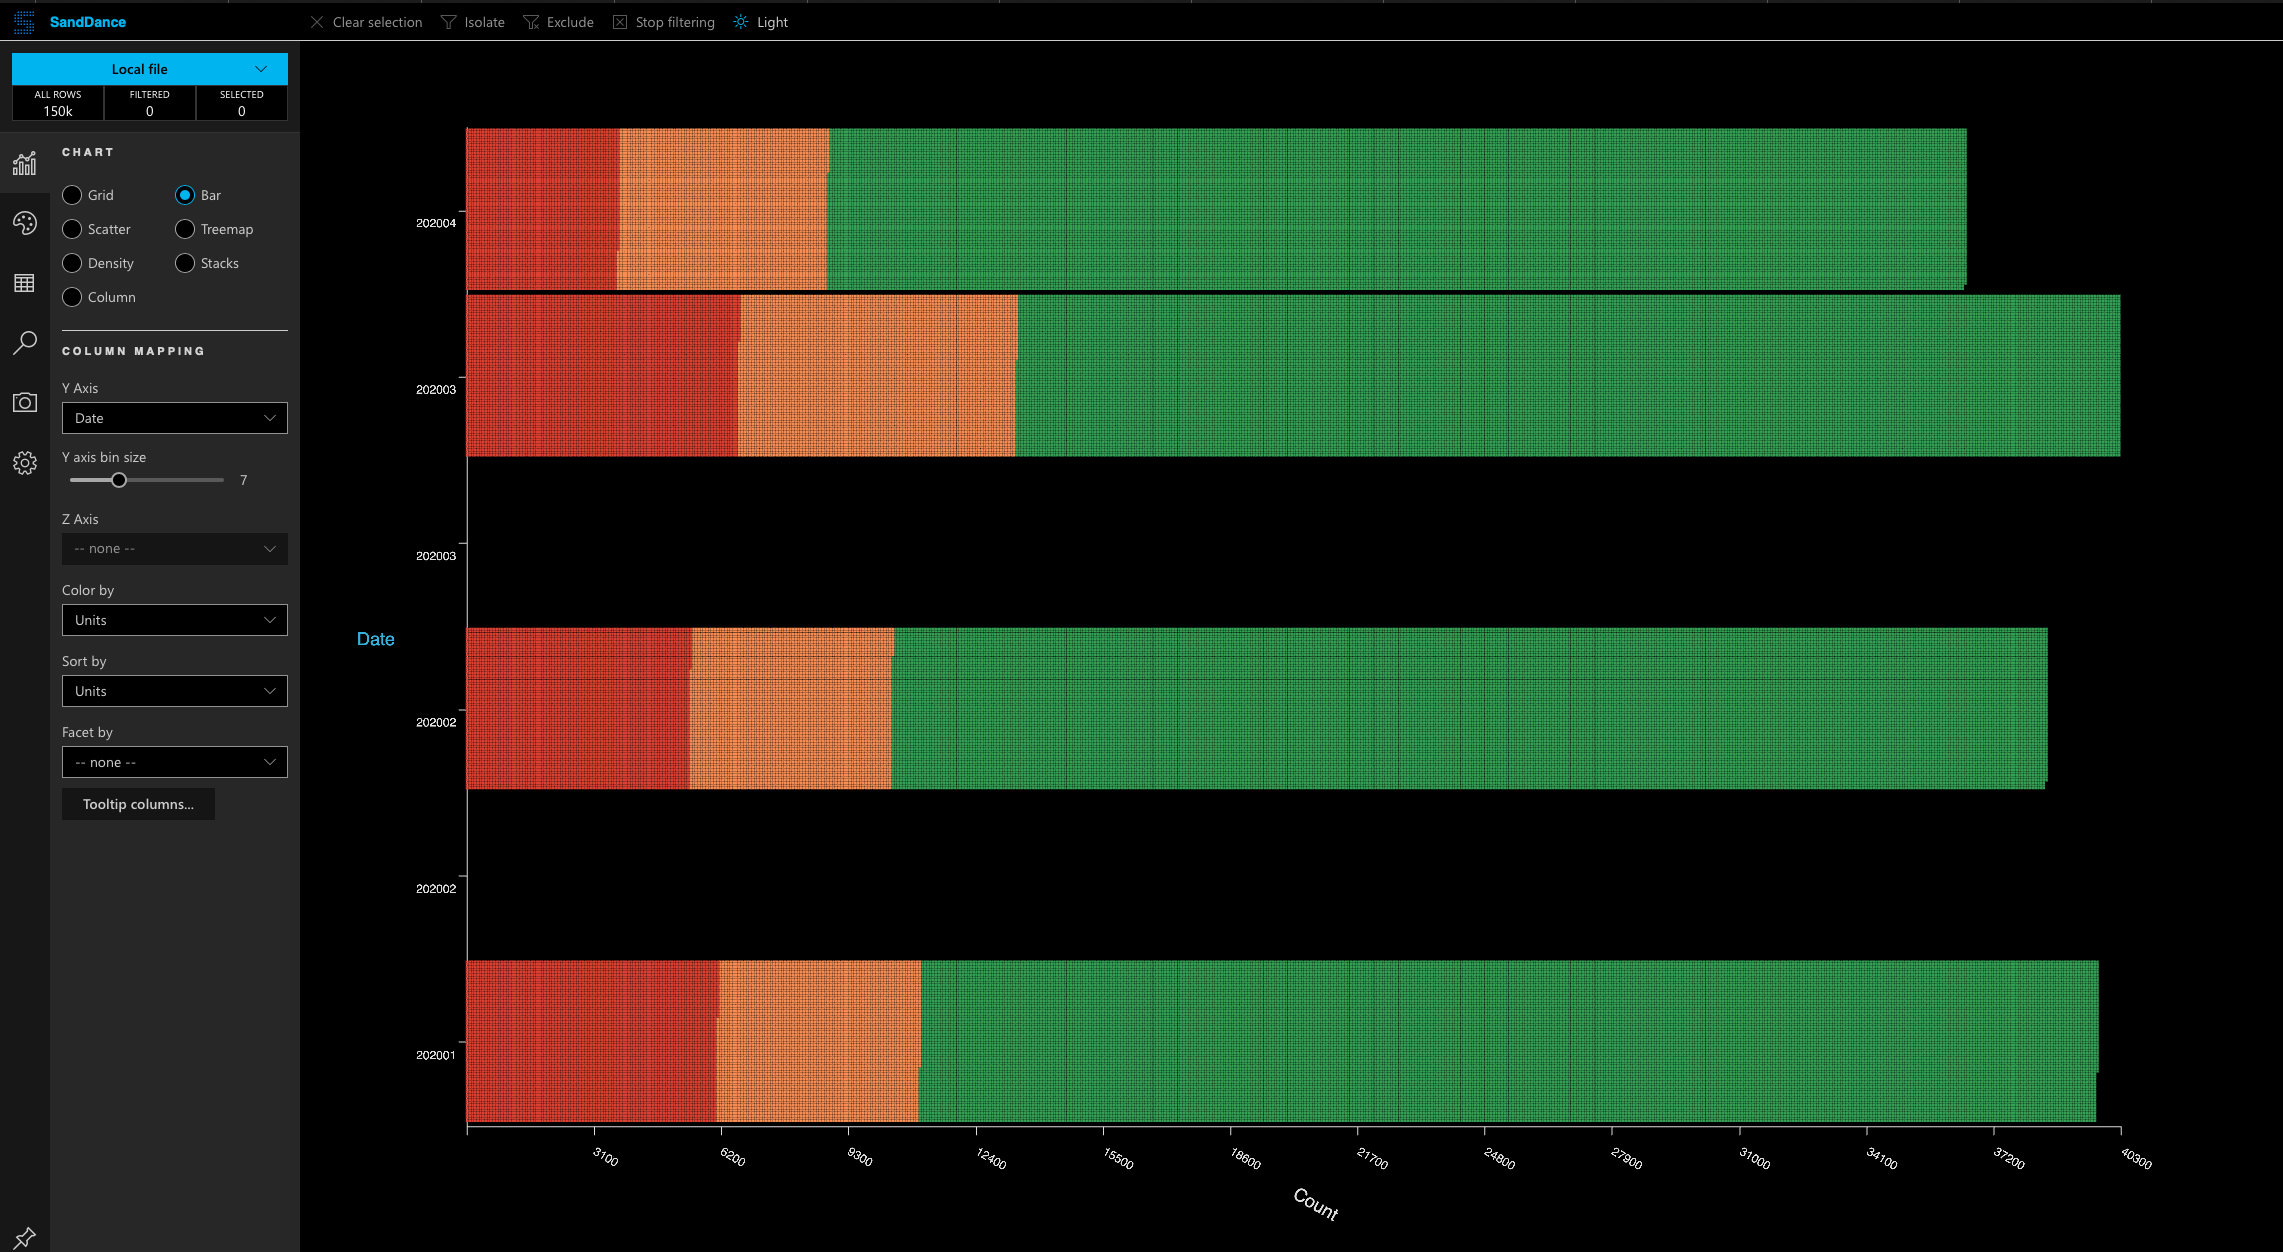
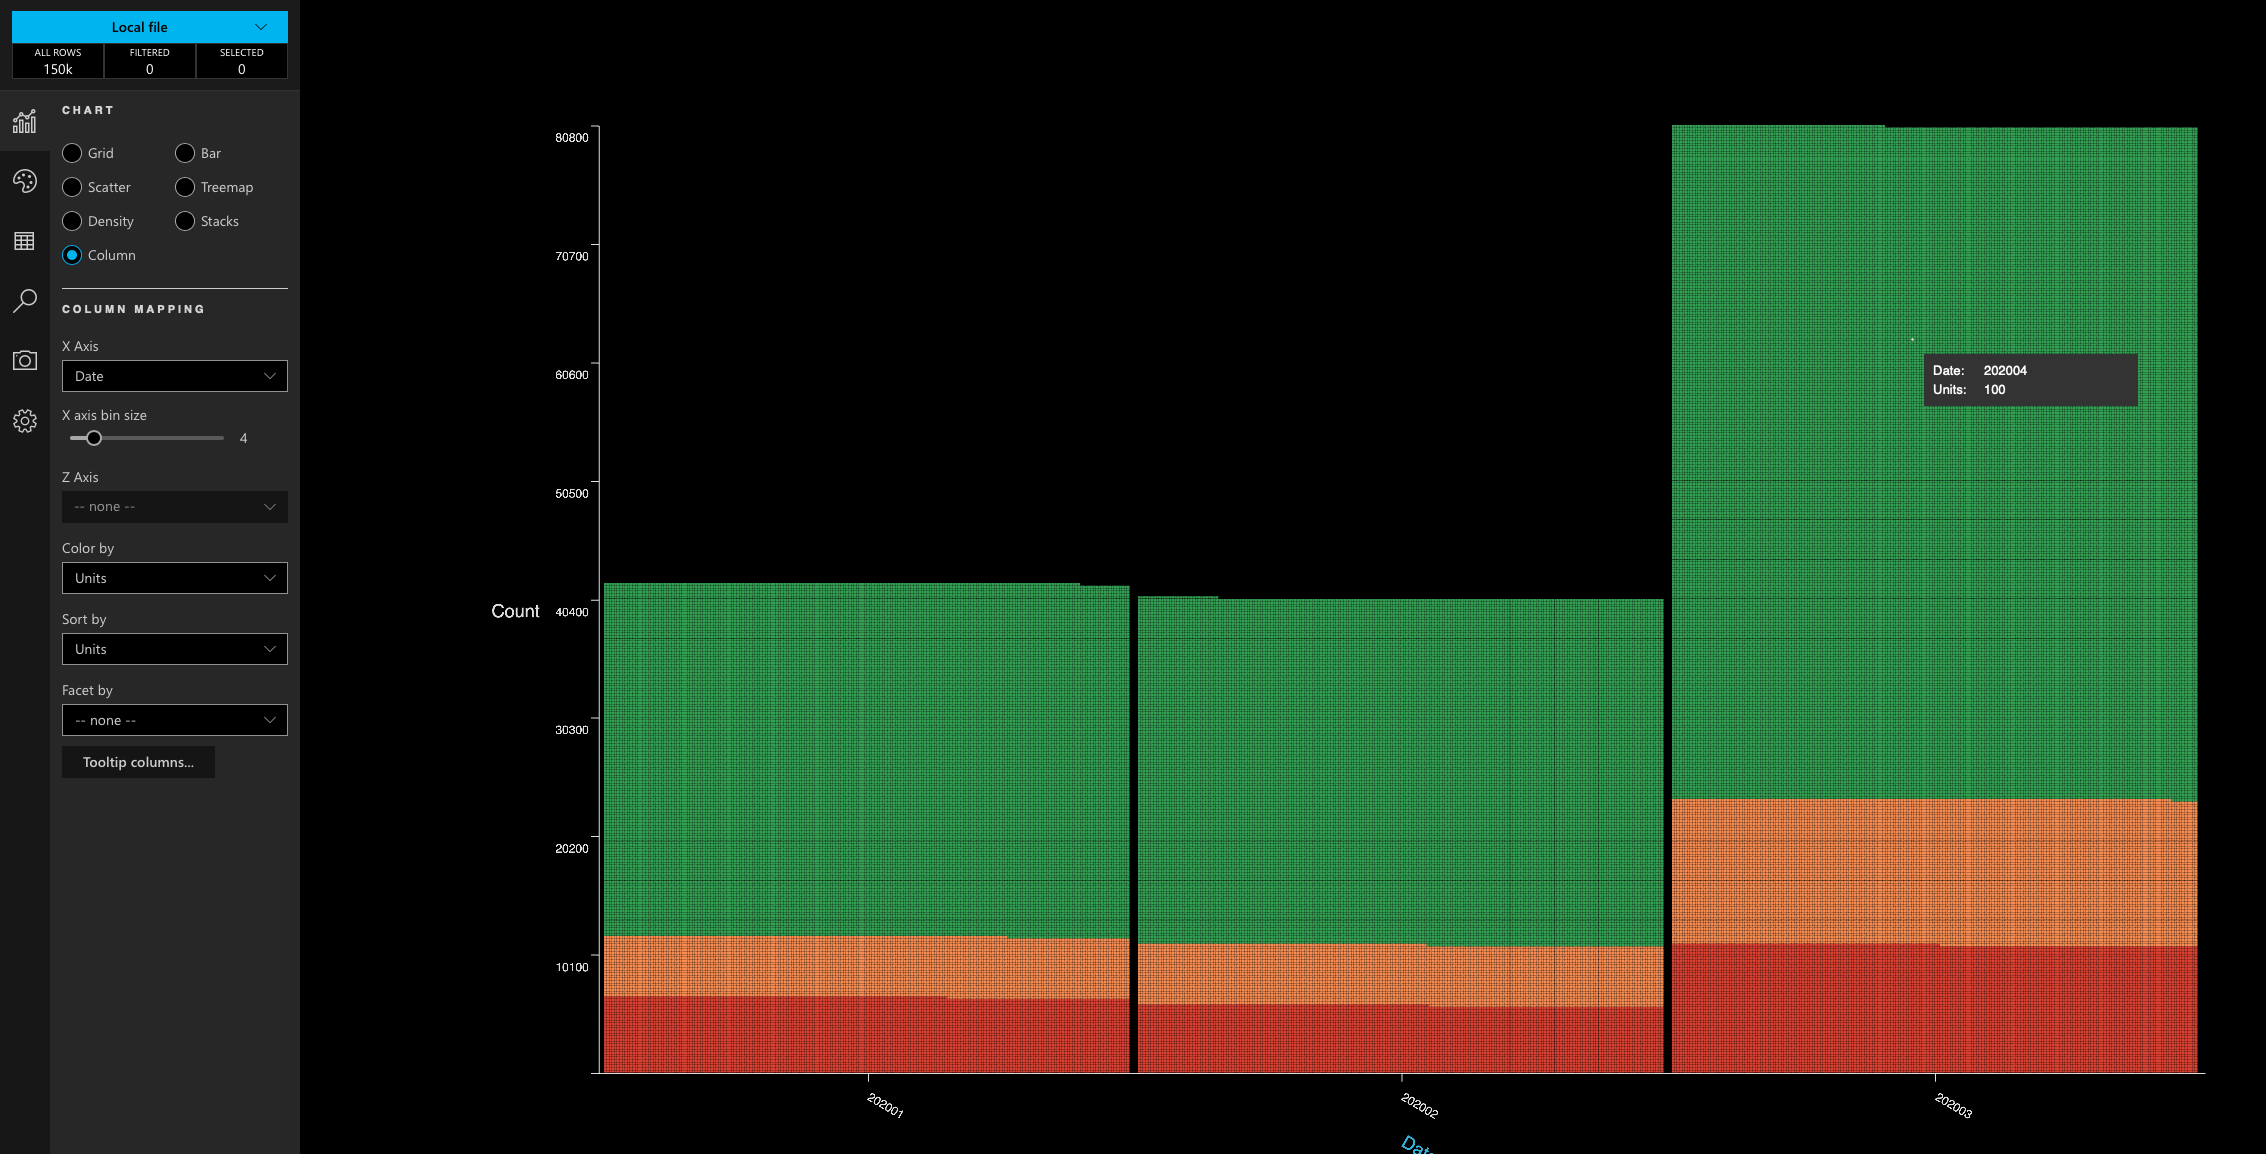
If I specify 4 bins (or even 5) it groups 2 of them!
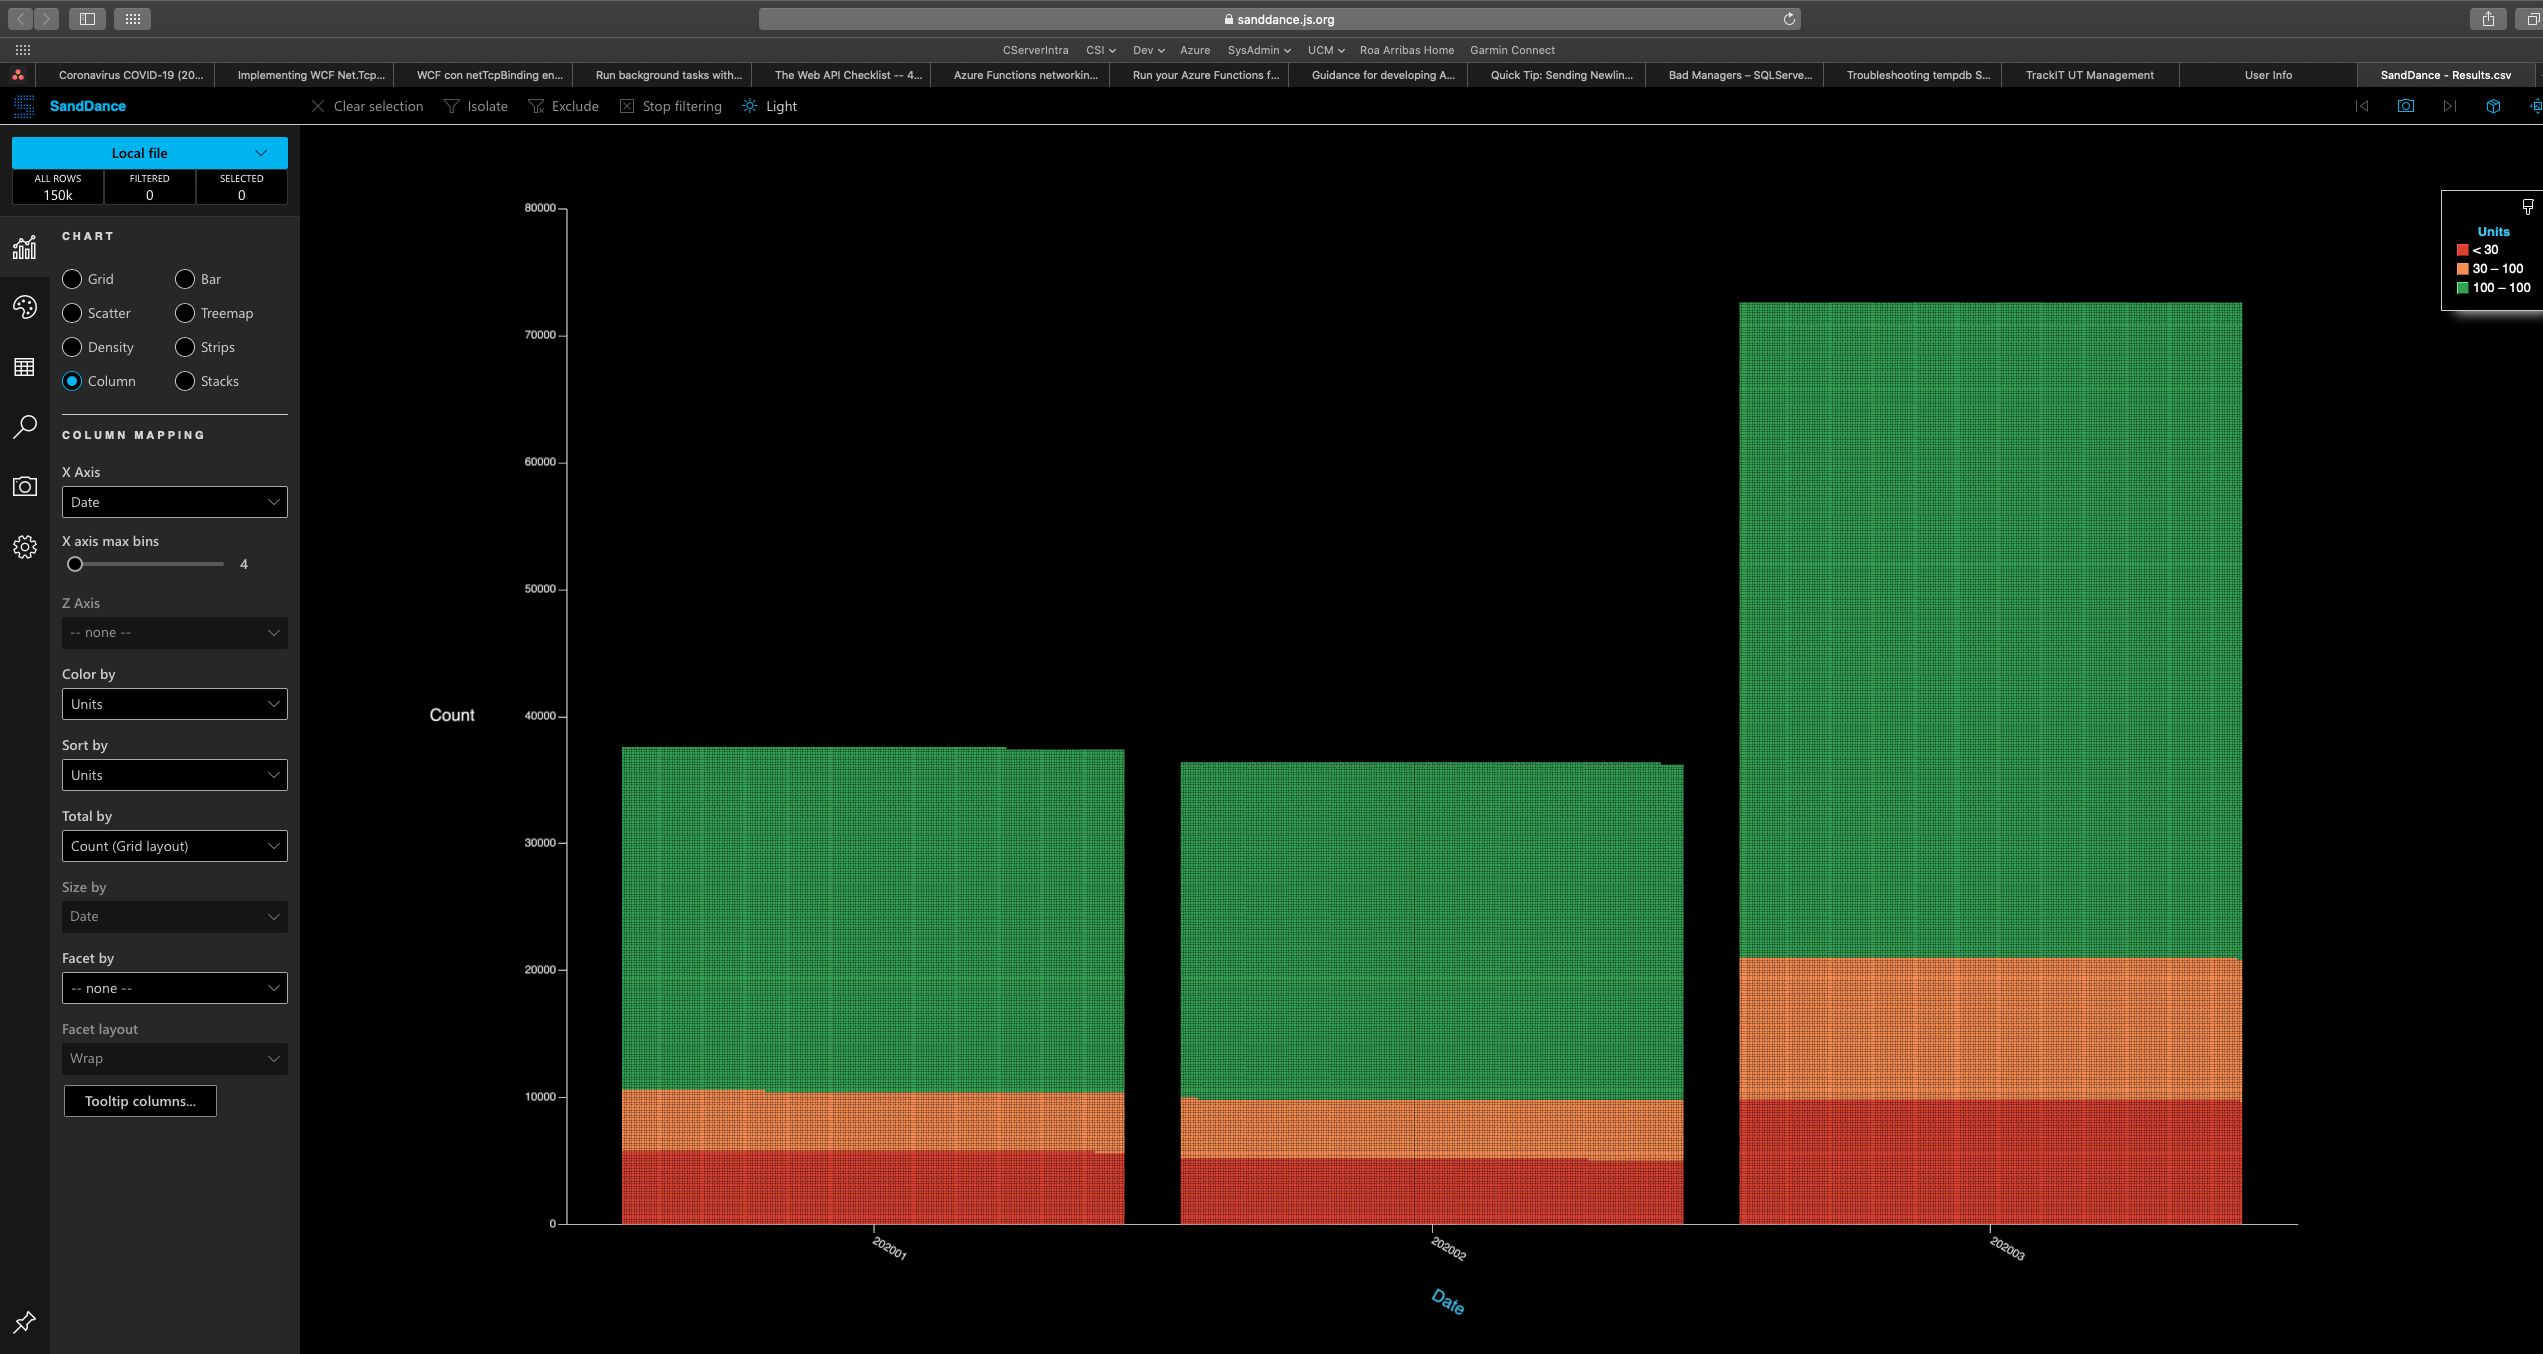
Thanks for the report. Can you see if this repros in our new beta version? https://sanddance.js.org/app-3.0.0-beta.1/
It happens too in the beta versión, it is even worst as x axis max bin slider is bigger and it is more difficult to limit to less bins (select 4 in this case) than before
I send you attached a copy of the dataset I’m using to test
I'm unable to repro in our latest version, so closing this for now. Thanks for the report and for providing a data sample for the repro.