difference in size between saved plot and fig
I do not understand why plots differ in terms of size and how they look when I try to save them or returnfig.
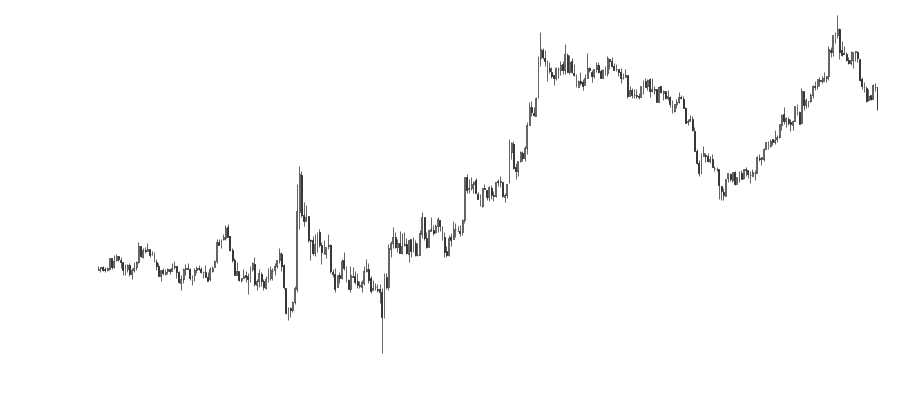
I generate plots of figsize (9,4) when I save them they look great, with a tight layout, no margins and axes excellent! But I need these plots again so it would be better to use a buffer instead. However, when I use the buffer resulting plot has a different size and added margins on one side.
The saved plot has size (365, 801, 1) while plot from the buffer (400, 900, 1).
I appreciate any suggestions how to use buffer but without adding margins. Thank you
I assume when using a buffer you are saving it somehow?
Can you show your code? If you show all your code, with some data, I can play with it and see what I can do. If I recall, when you ask matplotlib to savefig (as png or jpg, etc) it is using somewhat different code to render the image, so it is not guaranteed to look exactly the same; but there may be some work-arounds.
Hi Daniel, thanks for the quick response.
fig, ax = mpf.plot(data[0:350], figsize = (9, 4), type ='candle',
                       axisoff=True,
                       tight_layout=True,
                       returnfig = True)
canvas = FigureCanvasAgg(fig)
canvas.draw()
s, (width, height) = canvas.print_to_buffer()
X = np.frombuffer(s, np.uint8).reshape((height, width, 4))
plt.close()
return X
this code returns fig of size (400, 900)and converts to numpy array X. This is the goal. Code below does the same but through saving and loading
mpf.plot(data[0:350], figsize = (9, 4), type ='candle',
                axisoff=True,tight_layout=True,
                savefig = fig.png')
plt.close()
image = Image.open('fig.png')
numpy_fig = asarray(image)
return numpy_fig
This time the size of the figure is (365, 801). Data is simple OHLC price.
I have tried argument
savefig = buf
and transform buf into np.array but again the plot is bigger. The plot is not distorted, candles and other things are like supposed to be. It is just margins being added especially on the left side