Add streaming data example workbook
Demo idea
Publish a sample workbook that consumes a streaming data source from Azure or Pubnb. This is a common operations dashboard use case.
Reference streaming example: http://thuansoldier.net/?p=7187
Related links for the record:
- https://www.pubnub.com/solutions/geolocation-maps-geofencing/
- https://github.com/pubnub/eon-map
Adding in the possibility of streaming into PowerBI from a prospect request.
The organization as a whole is very engrained in PowerBI, since they're using this as main internal system to show the movements and data from various marine vessels. The current workflow is to pull a csv and do a manual refresh from a folder on the drive on their network. I don't have the current architecture for feeding the data into this folder, but I can get it if you need.
They expressed interest in the asset tracking architecture and blatantly said this would make their lives a lot easier. We've proposed building out a new dashboard, but since they're pretty engrained in PowerBI, its seeming like this would be a tougher path for them to take.
@ericaeckes "Streaming Datasets" in Power BI come with many limitations and are really meant for (near) real time data (e.g. IoT). They're a distinct animal that's a bit on the margin of how the vast majority of Power BI projects are done.
In my experience tracking marine vessels, they don't move that fast and most users would not care about real-time updates, as opposed to hourly or daily updates, which can be handled with regular (i.e. Import or DirectQuery) dataset refreshes. Are they pulling the data from an API such as MarineTraffic?
@otravers They're pulling that csv from their own sensors - from what I gathered from the conversation, they're not just pulling location, but also wind/temp/a few other marine-specific datapoints. Being unable to use streaming datasets within powerBI is a bit of a hassle for this team, but it seems that this workflow is their norm.
Would it be more helpful if I got a deeper understanding of their architecture?
@ericaeckes yes, to guide whether Power BI Streaming Datasets are the right fit, ideally you'll want to find out:
-
How the data flows from source sensors to destination map, probably with some staging/storing steps in between.
-
What's the data format?
-
What's the data collection frequency at the sensor level?
-
What's the needed dashboard update frequency, which may or may not align with sensor frequency? Just because the data is collected in real time doesn't mean it's needed to be displayed in real time.
-
What do they want to display: min/max, average, latest, outliers, etc? Is it just a map they need, or does the map need to integrated with a broader dashboard?
-
Is it just about the most recent timeframe, or is historical data (beyond a few hours) required?
-
Does the sensor data need to be blended with other data sources, or is the dashboard/map going to be single source?
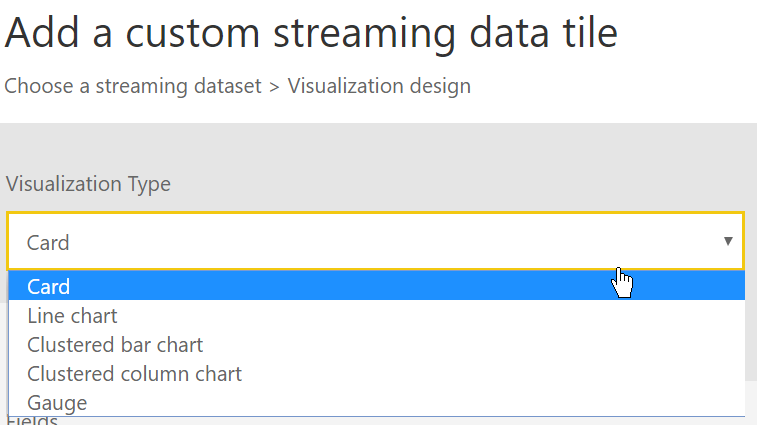
@ryanbaumann "real" Streaming or PubNub datasets are not going to work, as they're limited to just a few visual options, excluding custom visuals and even most default ones:
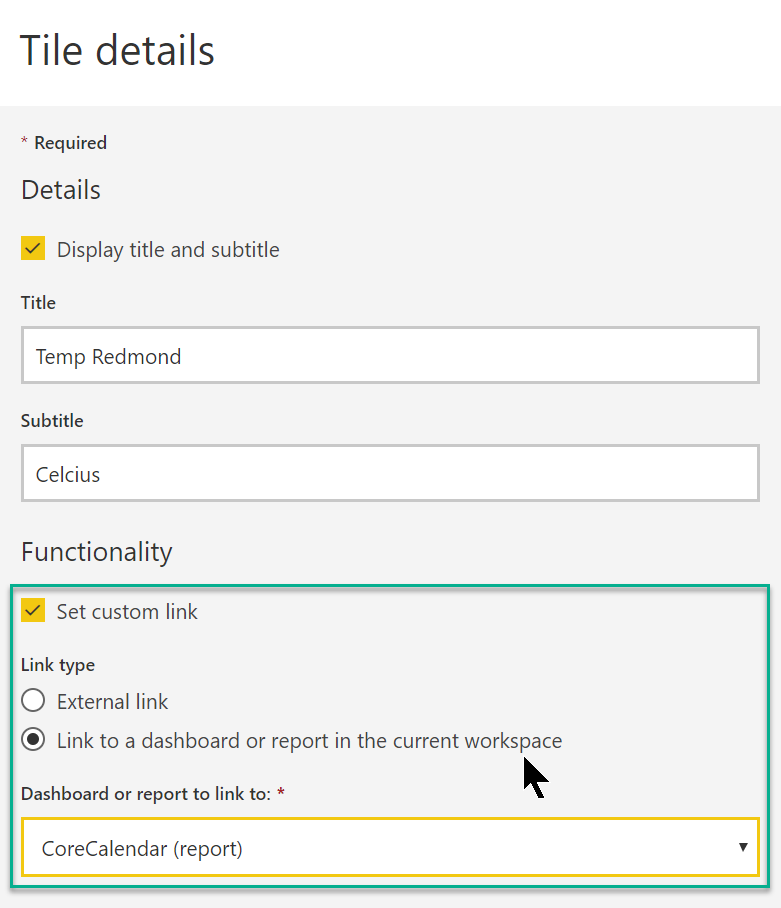
What you could do is display cards/gauges with a PubNub dataset showing the latest, then link these tiles to a regular report that has non real-time data including a map:
Alternatives (or complements) to using a Streaming/PubNub dataset:
-
Using a Push dataset like in the example you linked, for instance from Azure Stream Analytics. Here's the documentation.
-
Using a regular Import dataset with scheduled refreshes using a programmatic trigger (via the Power BI REST API or the just-released Flow action). There are limits in terms of number of refreshes per day depending on whether the workspace hosting the dataset is under PBI Pro or Premium capacity.
-
Using DirectQuery, which is a live connection to the source database, and thus usually less responsive to filtering than Import. Automatic page refresh was added two weeks ago, again Pro vs. Premium consideration apply. Under Shared Capacity (i.e. Pro) you can't do it more than every 30 minutes.