Unexpected behaviour when combining data from different tables.
I've created a simple example of the issue.
There are 3 tables: Person, Location, Data. Data contains PersonKey, LocationKey, Value. Both Person and Location has some coordinates.
When displaying the Person's coords on a map and then slicing by state, if the Person's name (or any other field) is added as a tooltip (or anywhere else really, e.g color) then the map behaves different than expected. The slicer affects the sizes of the circles/bubbles but it still shows all points and doesn't zoom into the specific selection (state). This works fine on Bing map. It also works fine when the coordinates are the ones from the Location table.
Note: I thought this could just be a bad design on my side at first, but since it works in Bing properly then I guess not.
I looked at your example and was able to replicate the behavior you're describing, which does feel unexpected.
It looks like Bing first applies the filter context to latitude and longitude, hence the zoom by state, then loads tooltips for whatever data is left after filters are applied. Whereas apparently Mapbox displays everything because your filter from Location doesn't apply to Person. Filters only apply from the 1 to the many side, they don't "swim upstream" from the many to the 1 side.
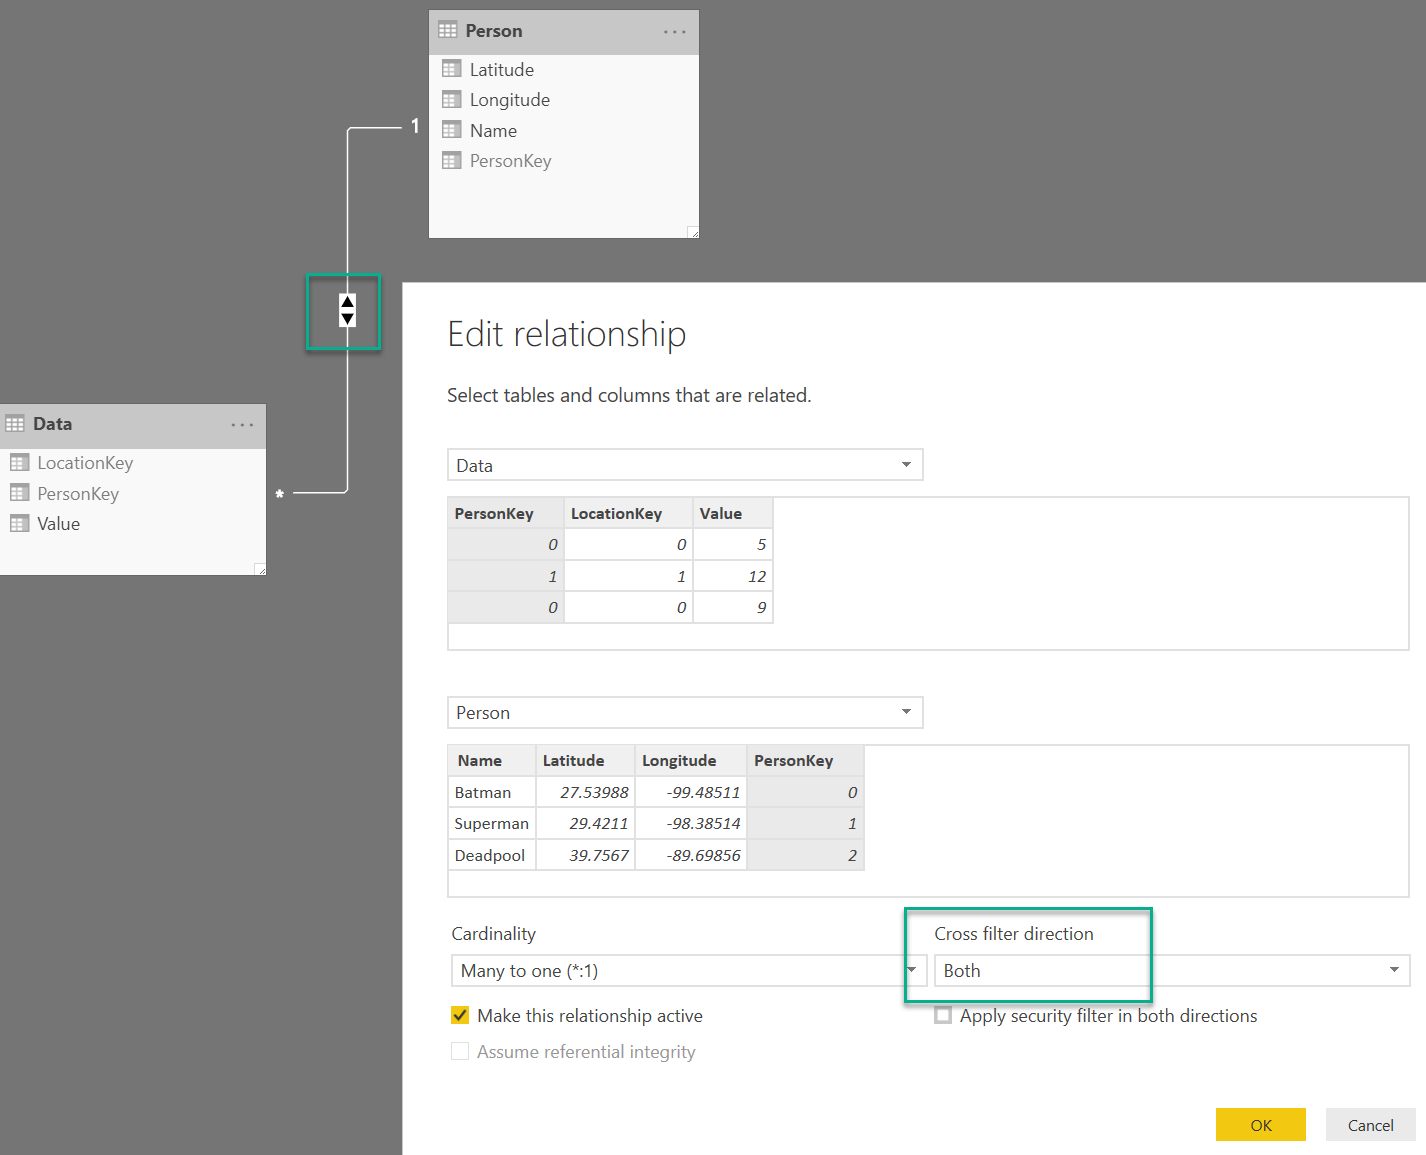
As a workaround, if you set the relationship to cross filter in both directions then Mapbox will behave as you intend. This is not ideal in terms of performance but might get out of a bind:
To be more intuitive and in line with the Bing behavior, Mapbox may want to consider ignoring columns in the Tooltip field for the purpose of evaluating the map's filter context.