Querying a different columns for each level of map
When making a categorical drill down map it would be useful to be able to load a different data column for each level.
For example : A US States maps that shows Democrat States in blue, Republican States in Red, and Swing States in purple. Then being able to drill down to county level to see Democrat Counties in Blue, Republican Counties in Red and Swing Counties in purple.
@humbertoandme There are already a couple of ways you can meet your requirement:
- Reshape your source data and/or measures so you're working off the granular county-level data (e.g. votes), in which case you'll need a state column to assign counties to the proper state. Here's a demo to show you this works:
- If you really need a separate column, you could use either bookmarks (caveat: you won't be able to use the regular drill up-down button), or if you want to do it the "proper" way, you could set up a geographical hierarchy with ISINSCOPE as described here: https://www.kasperonbi.com/use-isinscope-to-get-the-right-hierarchy-level-in-dax/
The issue I have with using hierarchies with color-coded conditional formatting (e.g. choropleths) is that the Min/Center/Values are hardcoded, and what you put for one level (State) won't work at more granular levels. This was discussed in https://github.com/mapbox/mapboxgl-powerbi/issues/266 with expression-based formatting as the most elegant solution.
Edit: I tested solution 2, it works OK though it's a bit awkward in a couple places, namely the map's title can't be dynamic because ISINSCOPE depends on row context, which the chart as a whole obviously doesn't have. Similarly the legend's label is a static value (the dynamic variable name). Demo below with population total at the state level and sex ratio at the county level (obviously this could be any measure you want).
Hi @humbertoandme, What you have indicated is possible but takes a bit of mucking around. See below for a similar exercise for the latest AU Federal Elections.
 The secret sauce is as @otravers indicated with the Inscope function in DAX. I've attached a zip file which contains the PBIX file for you to have a look at. Hope it helps.
AU Election Results.zip
The secret sauce is as @otravers indicated with the Inscope function in DAX. I've attached a zip file which contains the PBIX file for you to have a look at. Hope it helps.
AU Election Results.zip
Hi Oliver,
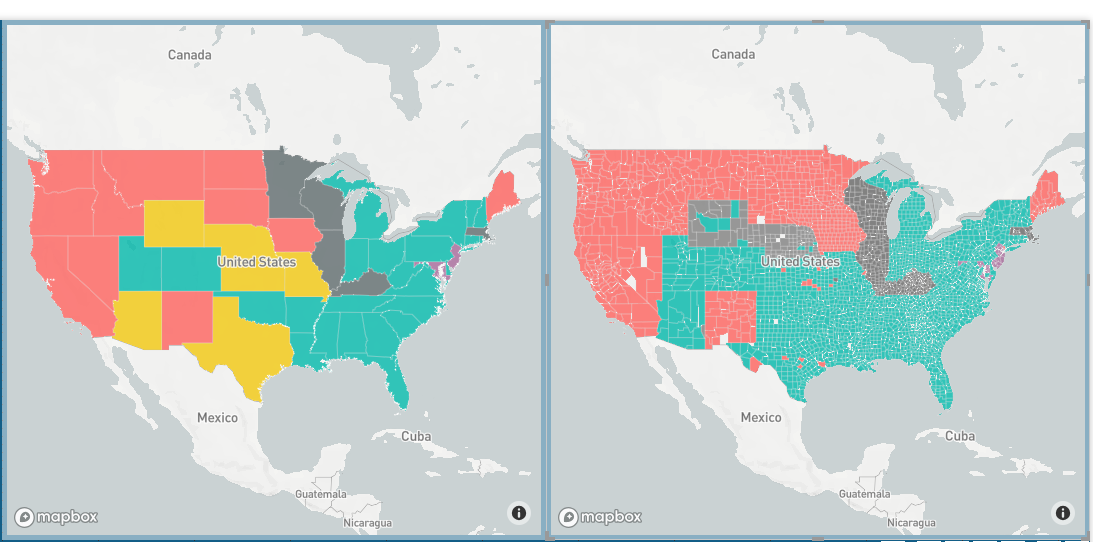
This still doesn't work because my data cannot be converted into granular or numerical data. I'm working on a report for legislators at a national level. Some states have "State Wide legalization" of a substance, others have "State Wide Prohibition" of the substance, a third set of states has "Home Rules" meaning they leave it up to the counties to decide. In these states "yellow" there may be " Legalization" counties and "Prohibition Counties". Currently, I'm solving the report with two maps next to each other, but clearly the drill down capabilities would be ideal.
This still doesn't work because my data cannot be converted into granular or numerical data
@humbertoandme This is where solution 2 (geo hierarchy + ISINSCOPE) comes into play as the Power BI model will "know" you have set up a hierarchy, which you can then leverage to build dynamic measures instead of hard-coding column references.
FYI I'm developing a re-usable template with US states/counties built in to help bootstrap solutions that meet requirements like yours, feel free to contact me offline ([email protected]) if you're interested.
For the purpose of Mapbox development I suggest you close this ticket as the visual can meet your requirement as is, provided you leverage Power BI's native ETL and modeling capabilities.