Combine map types with chloropleth maps
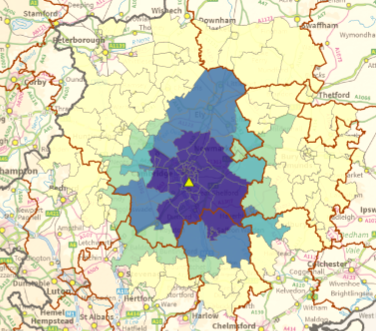
It would be a useful development, if you could combine the use of circle & chloropleth map types in 1 visualisation, as this would enable you to plot a geographic point(s) within the chloropleth fill. I have noticed that chloropleth maps are using the location field, where as venues are using latitude and longitude, so wondered if this would be a possible development to the visualisation. This would then enable both the points and chloropleth to be filtered by slicers (i tried creating a layer of the geographic points, but this then isn't effected by the filters as it is part of the map). I have included a picture below to give an idea of what i think you would be able to achieve.
Agreed this would be extremely useful. I have tinkered with the code and been able to successfully plot both a circle & choropleth, but the issue seems to be with the color palette. I believe multiple color (or size) palettes are needed -- one for the choropleth layer and one for the circle layer. For example if you have a choropleth layer with only 5 colors necessary, but your circle layer has 100 different points, the visual can't figure out how to get one palette to fit each granularity. It colors the circles correctly but the choropleth turns to black.