uPlot

uPlot copied to clipboard
Wrong zoomed range on Y axis after hiding/showing curve
I wish the zoomed range on Y axis to be maintained when the curve's visibility is toggled.
The following example demonstrates the issue. https://jsfiddle.net/20sk78Le/13/
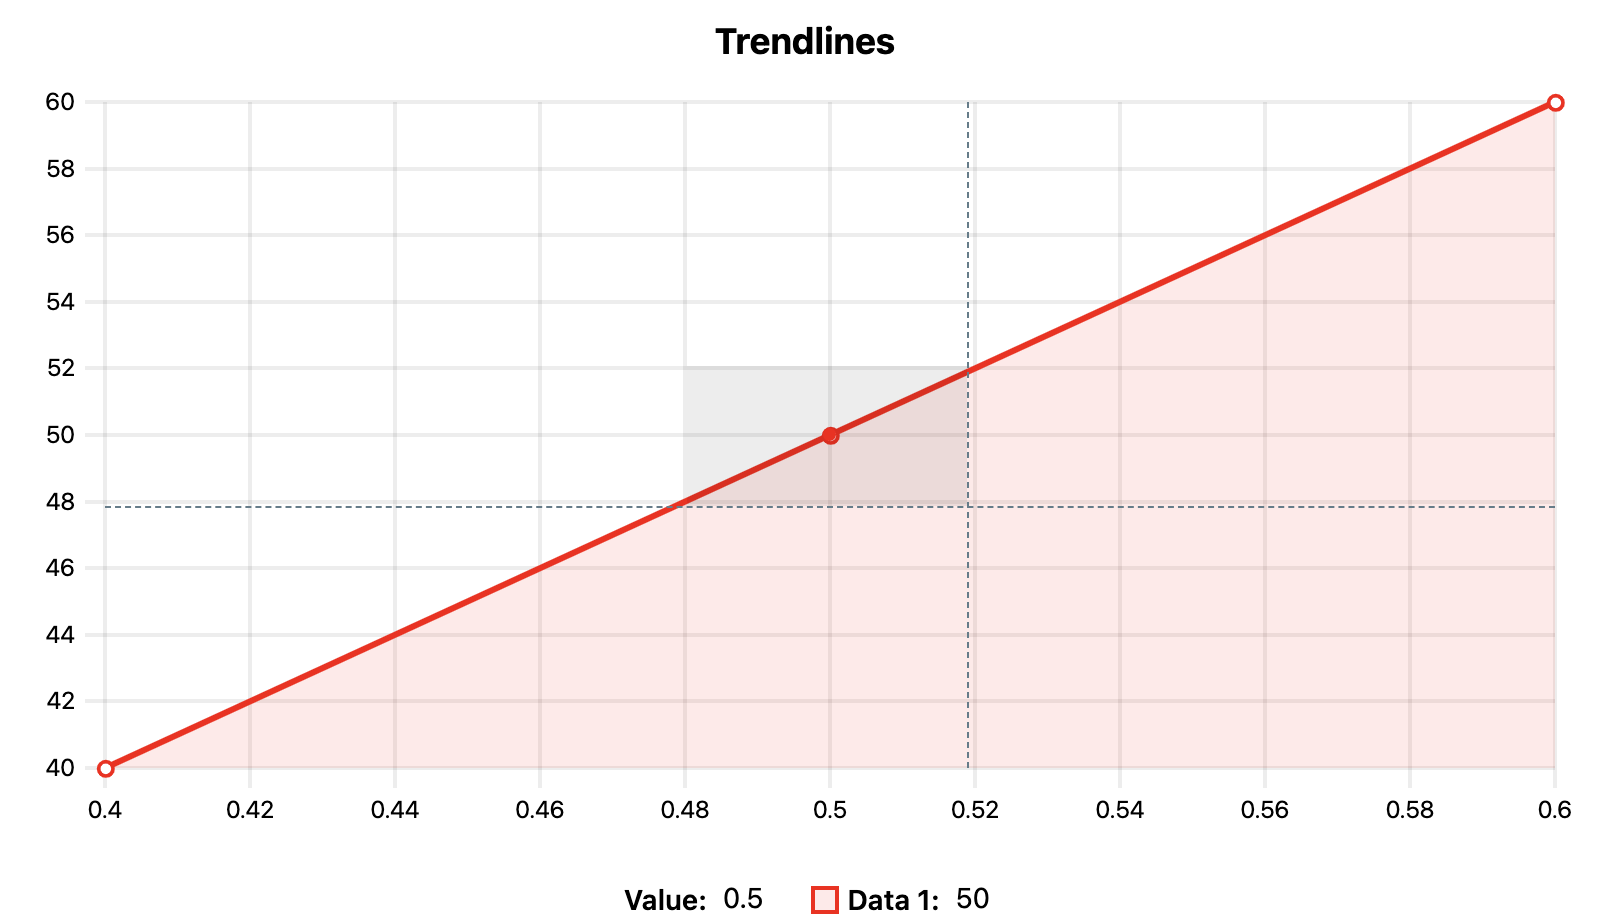
If you zoom like the attached image and then hide/show the curve you will notice that the Y axis range is not maintained, while works fine for X axis.
The console.log('Y min:', min, 'max:', max); does not get called when zooming.