X-Y Scatter Plots?
I've got some data of x and y position an was wondering if there's a way with the current line chart to be able to render an X-Y chart? So say, I've got x position and y position arrays. The indices of the elements in the array should match up. I'm looking to connect the points with a line as well. Is there a known way to do this with uplot?
Thanks!
kind of. you can specify time: false for the x scale and provide numbers for the x values (the data should still be sorted ascending). this will mostly work, even with duplicate x values, but the cursor interaction is still fundamentally a binary search over the x values and will get wonky. typically in real x/y you'd expect point-proximity for hover and zooming that doesn't give special treatment to X and then autoscale Y (you can set up rectangular zoom to kind of work around this: https://leeoniya.github.io/uPlot/demos/zoom-variations.html)
i expect proper scatter x/y support to land in several months: https://github.com/leeoniya/uPlot/issues/107
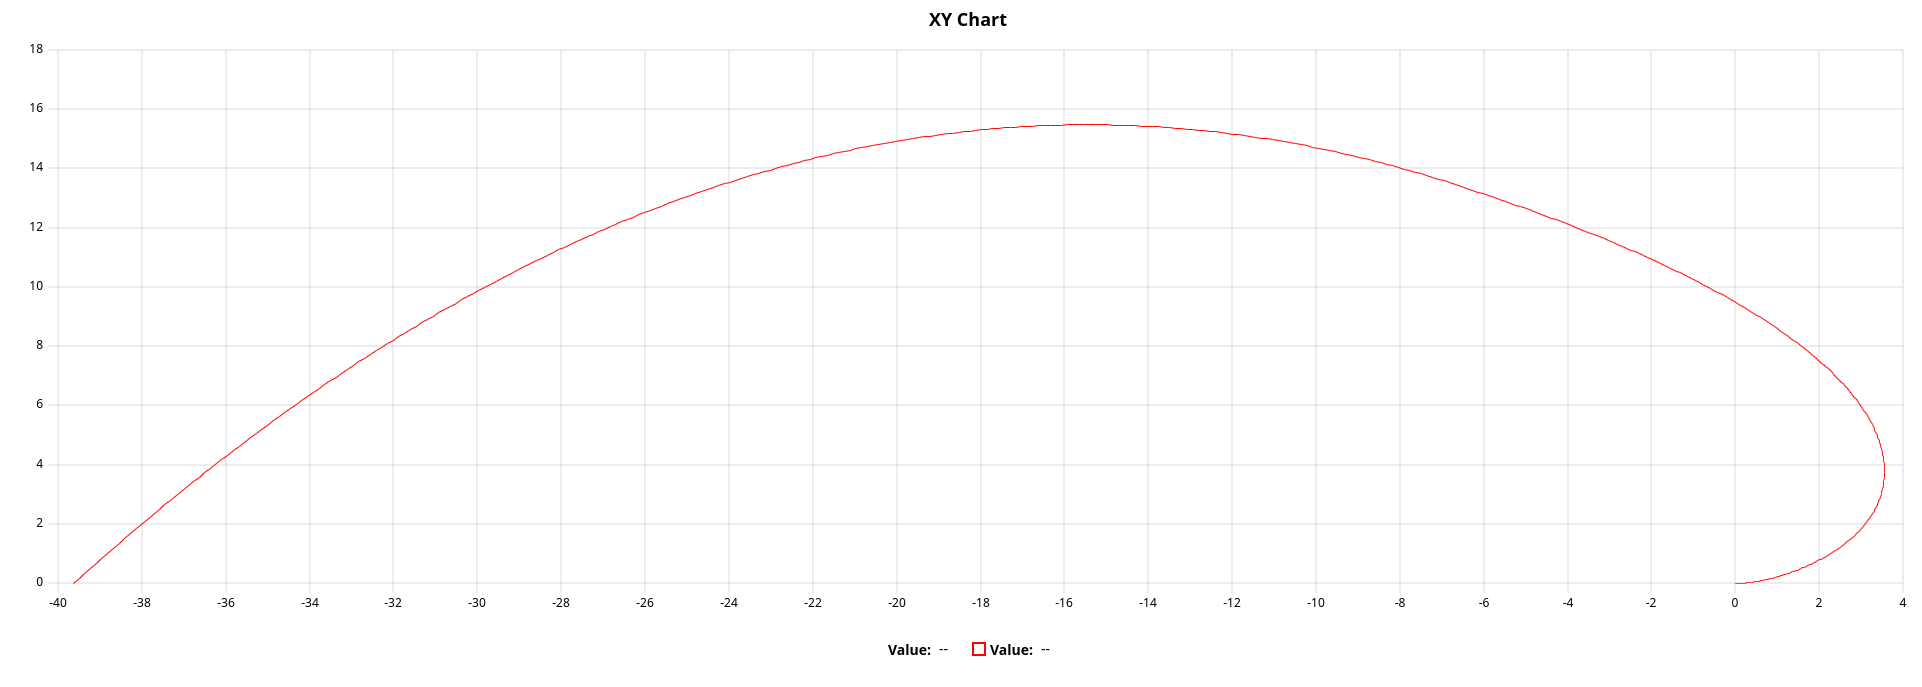
Awesome thanks! I've got a rocket sim here :https://codesandbox.io/s/fixed-rocket-sim-with-tvc-delay-pid-interval-50ms-0oq6u?file=/src/index.js
That uses this at the very bottom graph. Mind taking a look at it? It looks like duplicate values mess up a bit...
lol, i guess it doesnt quite work :)
i'll give this some more thought. a connected/unordered x/y is not quite the same thing as scatter, though there's a lot of overlap. it's easy enough to make a path builder that physically draws this, but there's more to the whole thing than just displaying it.
quick test:
things that likely would not be supported in an x/y builder are:
- gaps in data
- bands
- performance would be dependent on data size since lineTo calls would map 1:1. this means we'll want to optimize by reducing data during draw to the available pixels, e.g. via http://mourner.github.io/simplify-js/. your example has 100K points, which would be slow, but i think the curve can be reduced easily to 1K pts and still look the same while having 100x faster perf.
Can you share the code to make that test please? That looks exactly like what I need! An uconnected scatter plot would also work for me. Is there a way to just draw points with uplot?
Can you share the code to make that test please? That looks exactly like what I need!
i'll have more updates later this week.
An uconnected scatter plot would also work for me. Is there a way to just draw points with uplot?
https://github.com/leeoniya/uPlot/blob/7d7eda140d91dc5749d0a3df6d2cec0a19c4f625/demos/points.html#L48-L55
this will draw every point, but if you're drawing 100k points you'll not like the performance. the dataset reduction mentioned above still applies.