complex-upset

complex-upset copied to clipboard
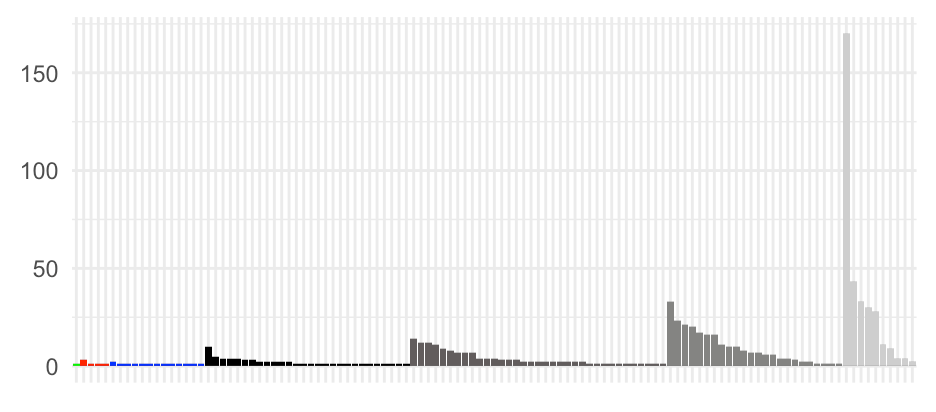
Adding break in y-axis?
Objective I would like to add a break in the y-axis of my graph as one bar is >150 while the others are <50, making them difficult to see. This is the code I've been using (I also borrowed code from another help request to color bars by degree). Thanks in advance for your help!
Code
library(ggplot2)
library(ComplexUpset)

query_by_degree = function(data, groups, params_by_degree, ...) {
    intersections = unique(upset_data(data, groups)$plot_intersections_subset)
    lapply(
        intersections,
        FUN=function(x) {
            members = strsplit(x, '-', fixed=TRUE)[[1]]
            if (!(length(members) %in% names(params_by_degree))) {
                stop(
                    paste('Missing specification of params for degree', length(members))
                )
            }
            args = c(
                list(intersect=members, ...),
                params_by_degree[[length(members)]]
            )
            do.call(upset_query, args)
        }
    )
}

disease_genes <- read.csv("disease_genes.csv")

disease_genes <- data.frame(disease_genes)
diseases = colnames(disease_genes)[2:10]
upset(disease_genes, diseases, name = "Diseases", sort_intersections_by=c('degree', 'cardinality'),
   matrix=intersection_matrix(
    geom=geom_point(shape='circle filled', size=1)
  ),
  base_annotations=list(
        'Intersection size'=intersection_size(counts=FALSE)),
  width_ratio = 0.1,
  queries=query_by_degree(
    disease_genes,
    diseases,
    set_sizes=upset_set_size() + theme(axis.text.x=element_text(angle=90)),
    min_size = 15,
    params_by_degree=list(
      '1'=list(fill='#CECECE'),
      '2'=list(fill='#848482'),
      '3'=list(fill='#625D5D'),
      '4'=list(fill='black'),
      '5'=list(fill='blue'),
      '6'=list(fill='red'),
      '7'=list(fill='green')
    ))) +
 ggtitle('Overlap of genes')
Screenshot or illustration
Context (required)
ComplexUpset version: 1.3.3
R version details
R version 4.1.0
R session information
<!-- Please replace this line by output of sessionInfo() -->
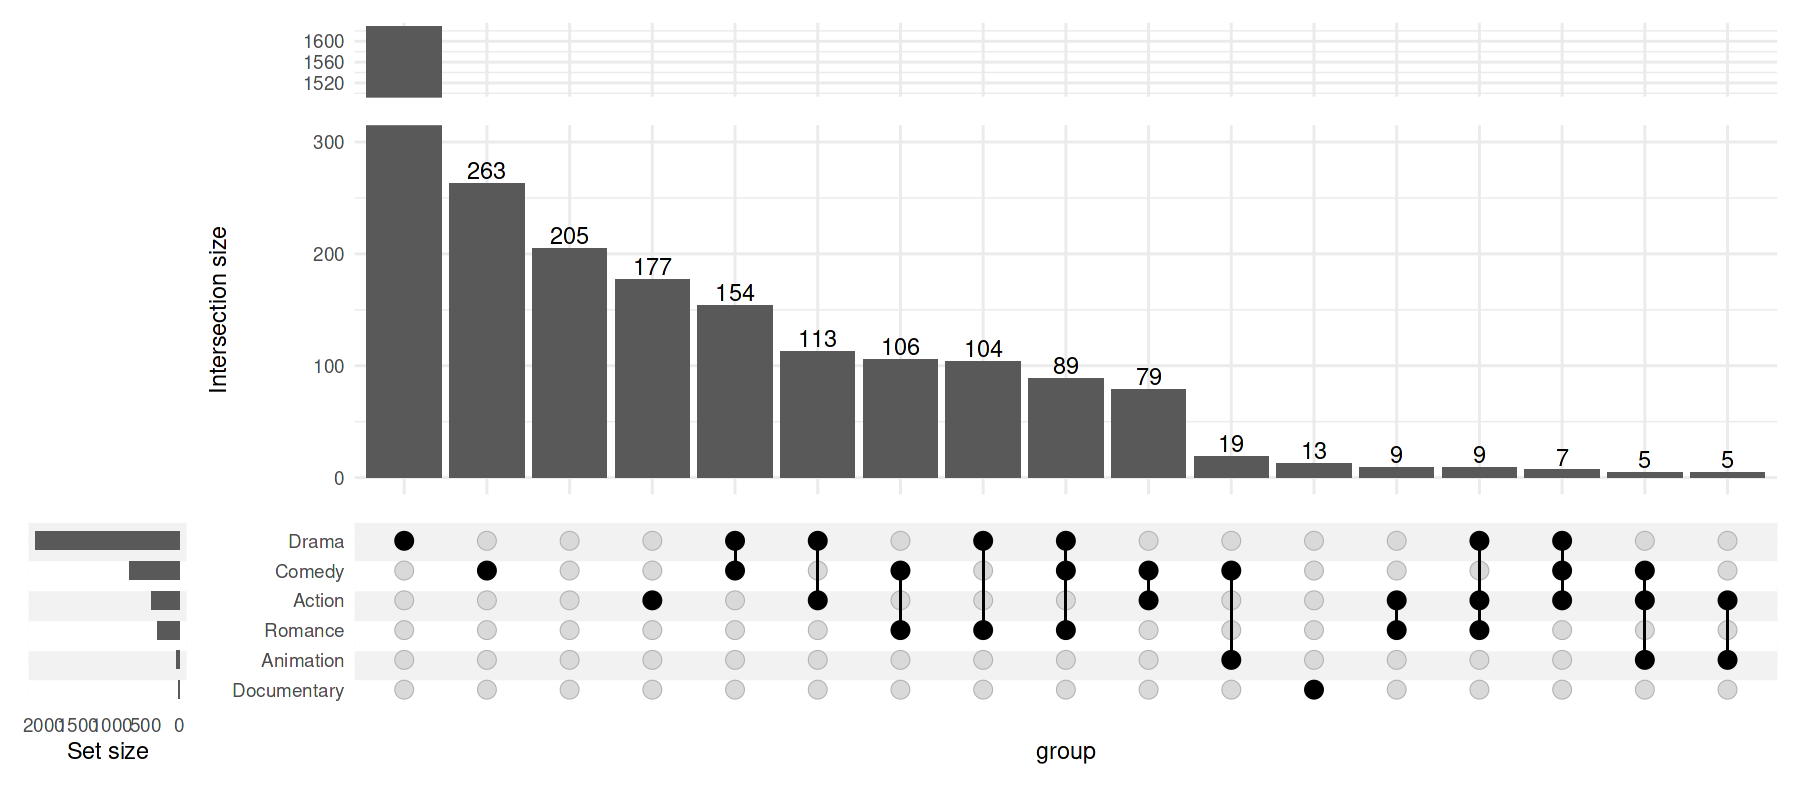
You can add multiple annotations, each limited to the range of interest. For example, starting from:
movies = as.data.frame(ggplot2movies::movies)
movies[movies$mpaa == '', 'mpaa'] = NA
movies = na.omit(movies)
genres = colnames(movies)[18:24]
# add 1200 on top of original 429 of Drama exclusives
movies = rbind(
    movies,
    movies[rep(which(movies$title == '15 Minutes'), 1200), ]
)

We can split it into the range <300 and >1500:
upset(
    movies,
    genres,
    base_annotations=list(
        'Intersection size (>1500)'=(
            intersection_size()
            + coord_cartesian(ylim=c(1500, NA))
            + ylab('')
        ),
        'Intersection size'=(
            intersection_size()
            + coord_cartesian(ylim=c(0, 300))
        )
    ),
    min_size=5,
    width_ratio=0.1
) + patchwork::plot_layout(
  # 20/total for >1500, 100/total for <300, 50/total for intersection matrix, where total = 20+100+50
  heights=c(0.2, 1, 0.5)
)
Hi, I would have a follow-up question to this: can the same be done for the "Set size" bars?