XChart

XChart copied to clipboard
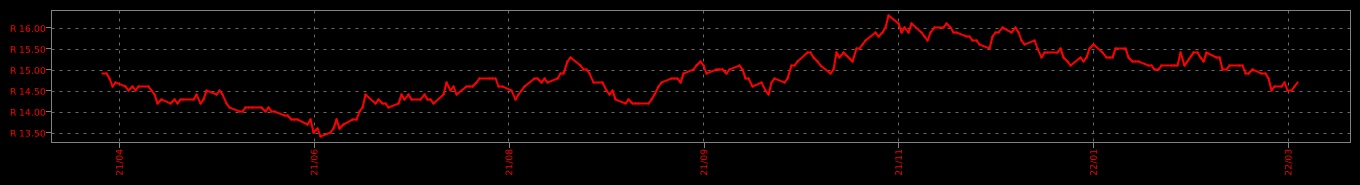
[Feature request] Allow YAxis to be inverted
Allow a user to create a chart with the YAxis inverted, i.e. max value at the bottom and min value on top. I use the chart to plot my country's currency (Rand) exchange rate vs. the dollar. If my currency increases in value, the exchange rate decreases, and on a plot it looks like the value decreases.
I have searched the API docs and Demo code and can not find anything like that.