down stream analysis: how to gets list of all the intersections and their members? how to use multilevel index?
UpSetPlot is a wonderful package. It creates beautiful plots. As part of my downstream analysis, I want to get a list of all the intersections and their members. I am having trouble understanding how to use the multilevel index created by from_contents().
Below is some test code I have been using to figure out how to do this. expectedSets is an example of a data structure I am trying to create from the output of from_contents().
Any suggestions would be greatly appreciated
Andy
p.s. show_counts looks like it may be a bug?
def createTestData():
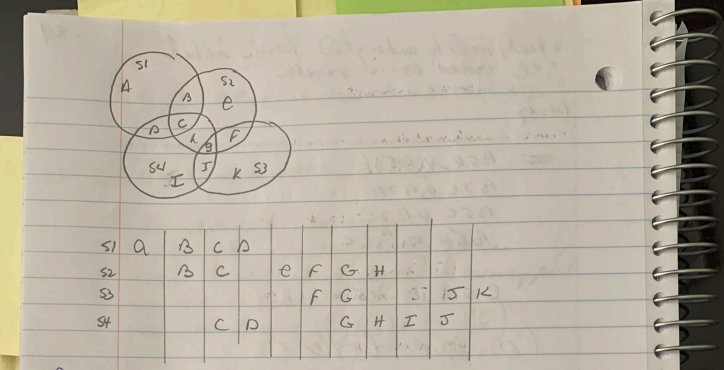
s1 = set( ['a', 'b', 'c', 'd'] )
s2 = set( [ 'b', 'c', 'e', 'f', 'g', 'h'] )
s3 = set( [ 'f', 'g', 'j', 'k'] )
s4 = set( [ 'c', 'd', 'g', 'h', 'i', 'j'] )
setList = [s1, s4, s2, s3]
setNames = ['s1', 's4', 's2', 's3']
dataDict = { setNames[i] : setList[i] for i in range(len(setList)) }
return( dataDict )
expectedSets = {'s1': {'a'},
's4': {'i'},
's2': {'e'},
's3': {'k'},
's1,s2': {'c', 'b'},
's1,s4': {'c', 'd'},
's2,s3': {'g', 'f'},
's2,s4': {'c', 'h', 'g'},
's3,s4': {'j', 'g'},
's1,s2,s4': {'c'},
's2,s3,s4': {'g'}
}
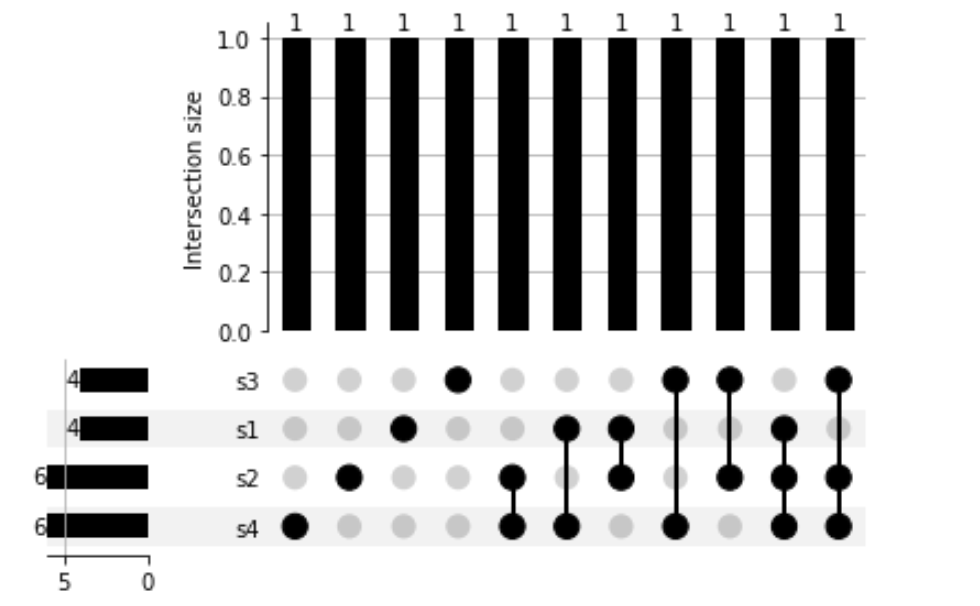
Generate a plot
geneSetsDict = createTestData()
geneSetsUpsetPlotData = upsp.from_contents(geneSetsDict)
pltDict = upsp.UpSet(geneSetsUpsetPlotData, show_counts=True).plot()
explore the index
inS1 = True
geneSetsUpsetPlotData.loc[(inS1), :]
notInS1 = False
geneSetsUpsetPlotData.loc[(notInS1), :]
The following works but seems like a hack. There is probably a better way to do this using native pandas
def findIntersectionElements(geneSetsDict, geneSetsUpsetPlotData):
    retDict = dict()
    retSingleSetDict = dict()

    # convert list to numpy array so we can use fancy array index
    setNames = list(geneSetsUpsetPlotData.index.names)
    setNamesNP = np.asarray(setNames)

    # for each intersection
    for idx in geneSetsUpsetPlotData.index.values:
        #print("\n********")
        arrayNP = np.asarray(idx)

        # get the list of sets that the intersection was formed from
        setNameList = sorted( setNamesNP[arrayNP] )
        setList = list()
        for sn in setNameList:
            setList.append( geneSetsDict[sn] )

        if len(setList) > 1:
            intersection = set.intersection( *setList )
            #print(intersection)
            key = ",".join(setNameList)
            retDict[ key ] = intersection

    # find elements that are not in an intersection
    n = len(setNamesNP)
    for i in range(0, n):
        testSetName = setNamesNP[i]
        knockOut = [True]*n
        knockOut[i] = False # the name to knock out
        unionSetNameList = setNamesNP[ knockOut ]

        unionSetList = list()
        for u in unionSetNameList:
            unionSetList.append( geneSetsDict[u] )

        union = set.union( *unionSetList )
        testSet = geneSetsDict[testSetName]
        intersection = testSet.difference(union)

        if len(intersection) > 0:
            retSingleSetDict[testSetName] = intersection

    return (retDict, retSingleSetDict)


geneSetsDict = createTestData()
geneSetsUpsetPlotData = upsp.from_contents(geneSetsDict)
retDict, retSingleSetDict  = findIntersectionElements(geneSetsDict, geneSetsUpsetPlotData)

retDict.update(retSingleSetDict)

assert retDict == expectedSets , 'ERROR'
{'s1,s2,s4': {'c'}, 's1,s4': {'c', 'd'}, 's1,s2': {'b', 'c'}, 's2,s3,s4': {'g'}, 's2,s4': {'g', 'c', 'h'}, 's3,s4': {'g', 'j'}, 's2,s3': {'f', 'g'}}

{'s1': {'a'}, 's4': {'i'}, 's2': {'e'}, 's3': {'k'}}
Dear Andy,
I came across your issue looking for a very similar feature of UpSetPlot. The library is really great, but I was also searching for a way to export the list of items reported in the specific intersections of the plot, not just to have the counts. I couldn't find anything in the documentation thus I looked at the code and found a solution that works for me. I just wanted to respond to this post in case someone else is looking for a similar thing.
In my view there is a misunderstanding of the set assignments in your example and this will also lead to confusion regarding the counts. UpSetPlot will not just do "simple" intersections of individual sets, but will assign each of your input items (a-k) to exactly one bin. All unique bins will then be shown in the plot. If we look at your bins in the expectedSets:
The first four entries ('s1': {'a'}, 's4': {'i'}, 's2': {'e'}, 's3': {'k'}) are correct, but the following ones ('s1,s2': {'c', 'b'}, 's1,s4': {'c', 'd'}, 's2,s3': {'g', 'f'}, 's2,s4': {'c', 'h', 'g'}, 's3,s4': {'j', 'g'}). should instead be: 's1,s2': {'b'}, 's1,s4': {'d'}, 's2,s3': {'f'}, 's2,s4': {'h'}, 's3,s4': {'j'} . Items c and g already have their own three-set assignments below ('s1,s2,s4': {'c'}, 's2,s3,s4': {'g'}) , and each item is assigned to exactly one bin only.
Thus the counts you were expecting were not in line with what UpSetPlot showed in the plot.
In your example code from the second post you're now computing all the "simple" set intersections that will result in what you defined in your expectedSets. But as I just wrote this is not what UpSetPlot shows, since items c and g will be listed in multiple bins. Thus we have to find another solution.
I've looked into the code of the UpSet class in plotting.py and noticed that the underlying dataframe actually contains the bin assignment for each input item, i.e. exactly what I was looking for. I apologize for the following hack, but I needed something quick: I just modified the code of UpSet's plot function to not just return the plot object, but also the dataframe. Now I can check for each input item to which bin it has been assigned in the corresponding plot.
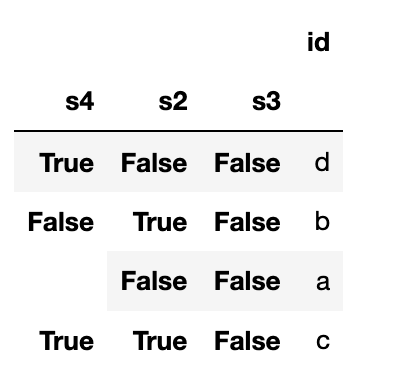
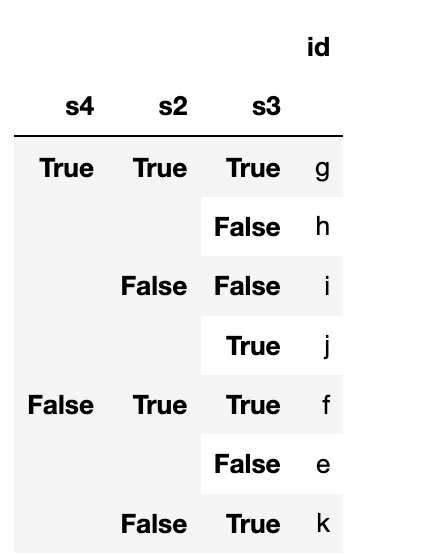
For your example, this is the content of the resulting dataframe (bin numbers correspond to left to right position in your plot):
                        id  _bin
s2    s4    s3    s1
False True  False True   d     8
True  False False True   b     7
      True  False True   c    10
False False False True   a     3
      True  True  False  j     6
True  True  True  False  g     9
False True  False False  i     1
True  True  False False  h     4
      False True  False  f     5
            False False  e     0
False False True  False  k     2
Maybe this is useful for someone, I'm now even happier with the library.
Best
Hey - sorry I've been busy and not finding time to handle these questions, but I wonder if you'd find the upsetplot.query function helpful!