Questions on pytorch-forecasting
- PyTorch-Forecasting version: 0.9.0
- PyTorch version: 1.9.0+cu102
- Python version: 3.7.4
- Operating System: Windows 10 Pro
Expected behavior
I have a dataframe of over 2000 items, and I am using pytorch-forecasting to try to predict prices based on dates and two more features. Following the stallion tutorial, I created a time index of 13 months; product_id and month are categories, and the other two features are continuous. Each product has a different number of rows and dates, but includes a full set of time_idx from 0 to 12 inclusive. I have the following questions:
-
When converting the dataframe into a TimeSeriesDataset, I added the categorical_encoders parameter with a dictionary containing month and product_id as keys and 'NaNLabelEncoder(add_nan=True)' as values, after getting the error of KeyError: "Unknown category '4' encountered. Set add_nan=True to allow unknown categories", but I am not sure if that was correct usage of the parameter.
-
The suggested learning rate: 9.549925860214362e-06 - is this not unusually small?
-
When creating the TemporalFusionTransformer model, I added log_interval=0 , which was suggested as a ' "hacky" workaround' to the histogram error in github issue 376 since I had the same error . Is this the only solution? I am still not able to see the histograms later.
-
When I try to return raw_predictions, I get the following error: raw_predictions, x = best_tft.predict(val_dataloader, mode="raw", return_x=True, show_progress_bar=True) RuntimeError Traceback (most recent call last)
in 1 #raw predictions are a dictionary from which all kind of information including quantiles can be extracted ----> 2 raw_predictions, x = best_tft.predict(val_dataloader, mode="raw", return_x=True)
~\anaconda3\lib\site-packages\pytorch_forecasting\models\base_model.py in predict(self, data, mode, return_index, return_decoder_lengths, batch_size, num_workers, fast_dev_run, show_progress_bar, return_x, mode_kwargs, **kwargs) 1058 output = _torch_cat_na(output) 1059 elif mode == "raw": -> 1060 output = _concatenate_output(output) 1061 1062 # generate output
~\anaconda3\lib\site-packages\pytorch_forecasting\models\base_model.py in _concatenate_output(output) 90 # concatenate simple tensors 91 if isinstance(v0, torch.Tensor): ---> 92 output_cat[name] = _torch_cat_na([out[name] for out in output]) 93 # concatenate list of tensors 94 elif isinstance(v0, (tuple, list)) and len(v0) > 0:
~\anaconda3\lib\site-packages\pytorch_forecasting\models\base_model.py in _torch_cat_na(x) 68 for xi in x 69 ] ---> 70 return torch.cat(x, dim=0) 71 72
RuntimeError: torch.cat(): Sizes of tensors must match except in dimension 0. Got 347 and 354 in dimension 3 (The offending index is 1)
- When trying to plot raw predictions, I get an error, for example: best_tft.plot_prediction(x, raw_prediction, idx=0)
RuntimeError Traceback (most recent call last)
~\anaconda3\lib\site-packages\pytorch_forecasting\models\temporal_fusion_transformer_init_.py in plot_prediction(self, x, out, idx, plot_attention, add_loss_to_title, show_future_observed, ax) 684 # add attention on secondary axis 685 if plot_attention: --> 686 interpretation = self.interpret_output(out) 687 for f in to_list(fig): 688 ax = f.axes[0]
~\anaconda3\lib\site-packages\pytorch_forecasting\models\temporal_fusion_transformer_init_.py in interpret_output(self, out, reduction, attention_prediction_horizon, attention_as_autocorrelation) 572 573 # histogram of decode and encode lengths --> 574 encoder_length_histogram = integer_histogram(out["encoder_lengths"], min=0, max=self.hparams.max_encoder_length) 575 decoder_length_histogram = integer_histogram( 576 out["decoder_lengths"], min=1, max=out["decoder_variables"].size(1)
~\anaconda3\lib\site-packages\pytorch_forecasting\utils.py in integer_histogram(data, min, max) 31 if max is None: 32 max = uniques.max() ---> 33 hist = torch.zeros(max - min + 1, dtype=torch.long, device=data.device).scatter( 34 dim=0, index=uniques - min, src=counts 35 )
RuntimeError: index 36 is out of bounds for dimension 0 with size 11
- Could you elaborate a bit more on each of the graphs produced by this code? predictions, x = best_tft.predict(val_dataloader, return_x=True) predictions_vs_actuals = best_tft.calculate_prediction_actual_by_variable(x, predictions) best_tft.plot_prediction_actual_by_variable(predictions_vs_actuals);
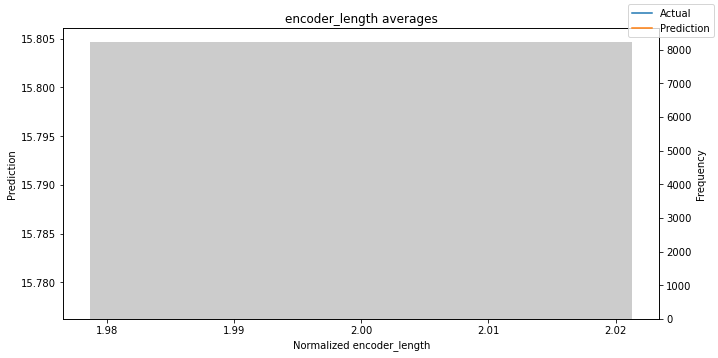
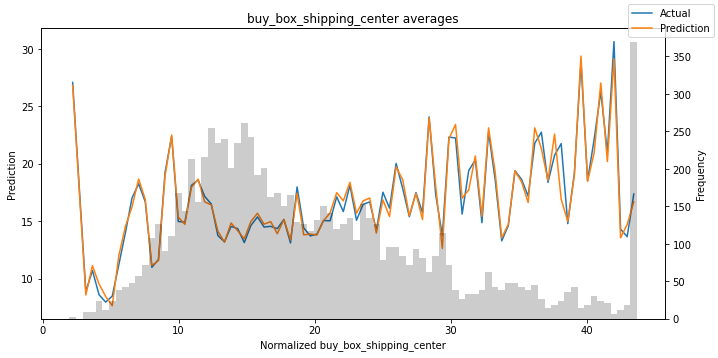
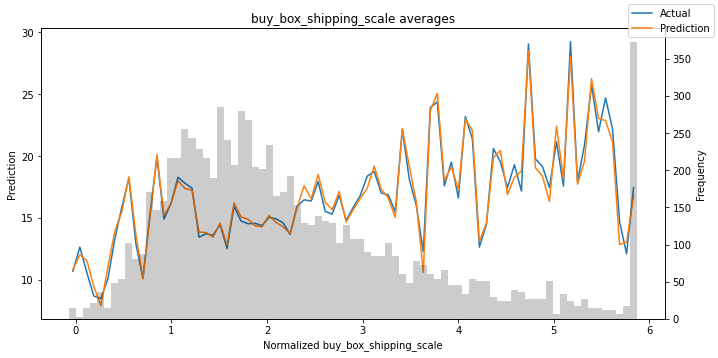
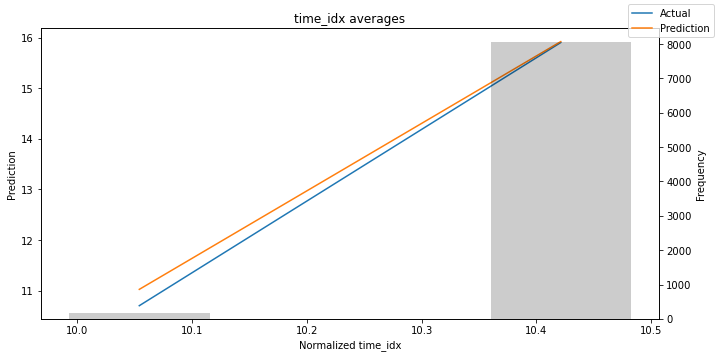

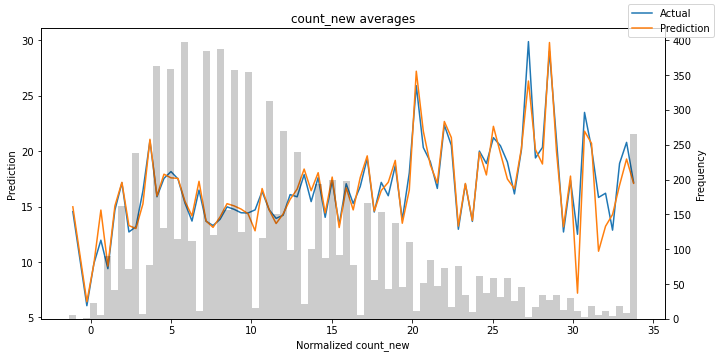
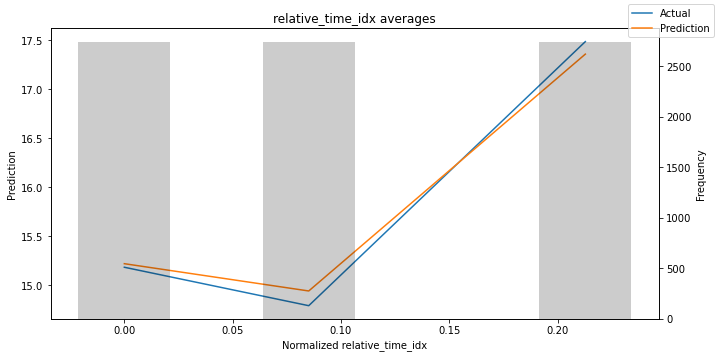
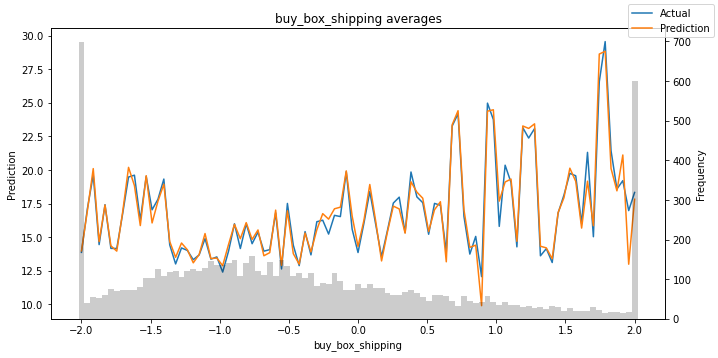
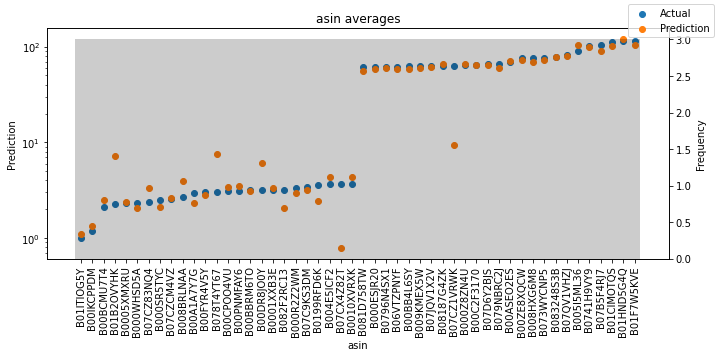
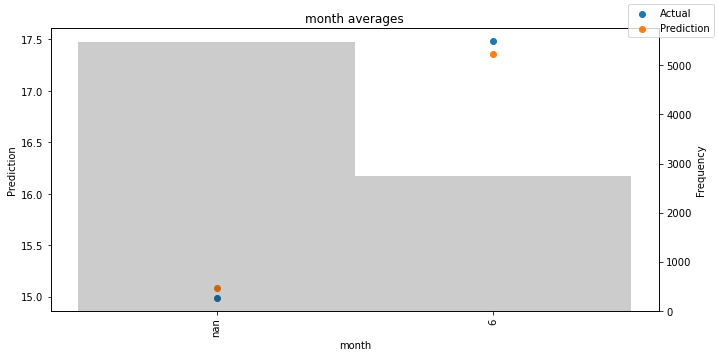
- What is the difference between the target scale averages, the target center averages, and the target averages?
- What is the change of the line graph?
- What is the x-axis?
- Is each point a product?
- Is the prediction at only one point in time?
- How is time seen?
- Why are ALL the product_ids not on the graph?
- The month is probably set to 0 on the graph because of the add_nan=True, but why is this different than the stallion tutorial?
-
I saw github issue 224 which discusses predictions and plotting of predictions. What does the term "returning predictions at multiple horizons" mean? At each time_idx, it looks like only one time horizon is populated in the prediction dataframe- why is that?
-
The following join: original_df_with_predictions = df.join(df_pred, on=df_pred.index.names) does not work, I think because the time_idx is not the same as the one in the original dataframe - how can I fix this?
@jdb78 Thanks so much for the successful model, and hoping to hear from you soon!
Code to reproduce the problem
Here is a link to a colab notebook to run the code and reproduce the output: https://github.com/Bassie1/notebooks/blob/main/model_github.ipynb And here is a link to the dataset used: https://github.com/Bassie1/notebooks/blob/main/github_data.csv
I am getting the same issue, you just nêd to not plot attention, which mean add plot_attention = False, inside the plot_prediction. However, Idk how to solve it from the root