explorer

explorer copied to clipboard
Add placeholder statistics page
As a token holder, I want to see graphs/charts of network metrics over a period of time, so I can asses network growth.
Charts:
- Daily #:
- of transactions
- of active addresses
- of iota/shimmer transferred
- of blocks
- Total:
- per block payload type
- distinct native tokens (not supply count but how many unique native tokens there are)
- nfts minted
- tokens used for storage
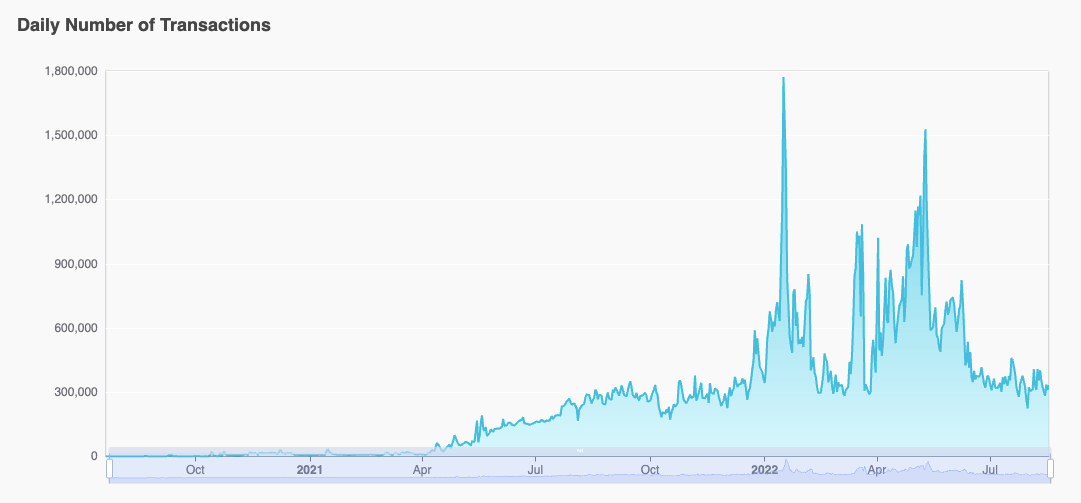
A daily chart would look like this:
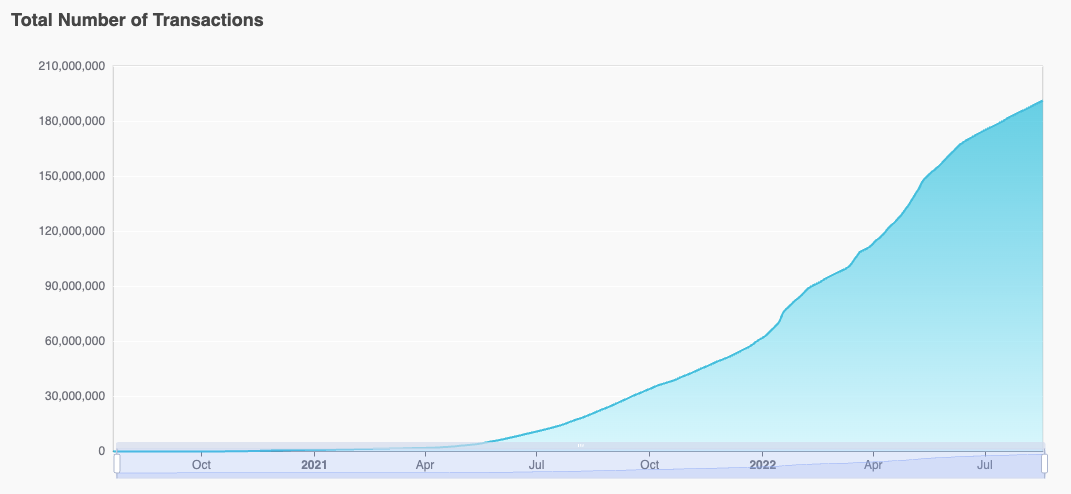
while a total would represent the total over the period of time:
Acceptance criteria:
- Charts can be zoomed in and out/timeframe can be narrowed.
- Charts must load with data from the beginning of recording.
- Charts must load in under 5 seconds.