Improve contrast of interaction heatmaps
First of all, I'm impressed by the visualizations of the package. Thanks a lot for all your efforts.
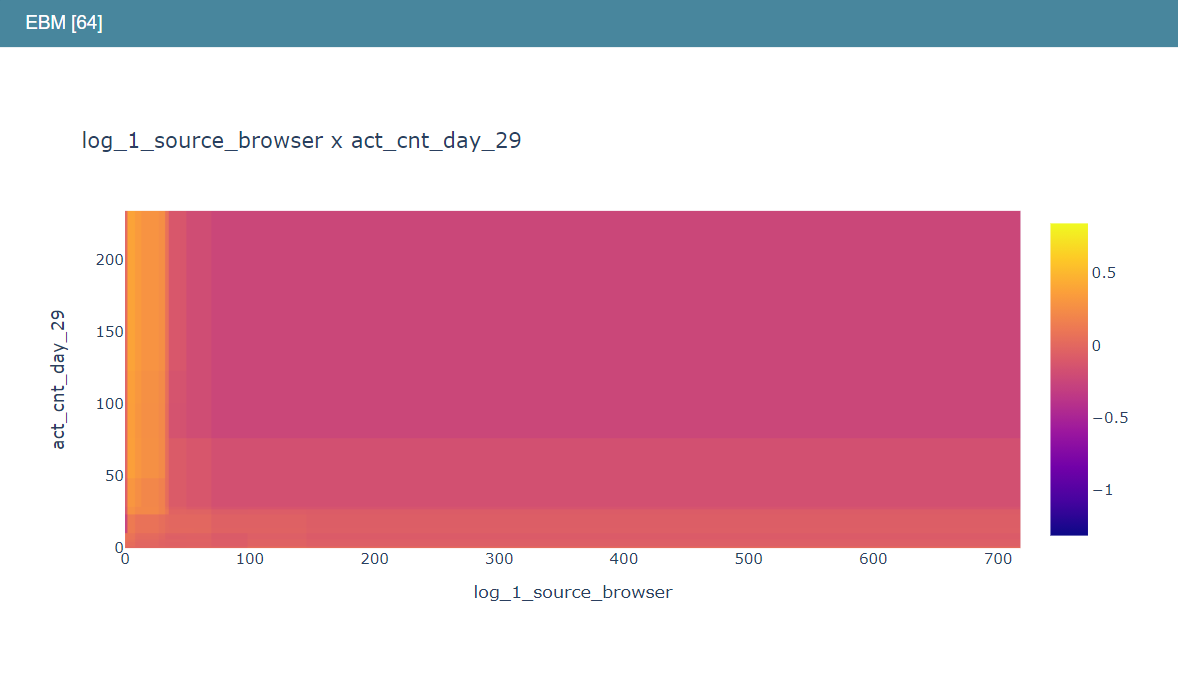
I do have a question regarding the contrast of the heatmaps. The heatmaps use global scores range to initialize their color bar.
This results in a rather large range per interaction feature resulting in little contrast in the plot:
If the range of the interaction feature would be used, there is much more contrast and this might help interpretation:

code in interpret/python/interpret-core/interpret/visual/plot.py, line 606:
def plot_pairwise_heatmap(data_dict, title="", xtitle="", ytitle=""):
    if data_dict.get("scores", None) is None:  # pragma: no cover
        return None

    bin_labels_left = data_dict["left_names"]
    bin_labels_right = data_dict["right_names"]
    bin_vals = data_dict["scores"]

    bin_vals = np.ascontiguousarray(np.transpose(bin_vals, (1, 0)))

    heatmap = go.Heatmap(z=bin_vals, x=bin_labels_left, y=bin_labels_right)
    # if data_dict.get("scores_range", None) is not None:
    #     heatmap["zmin"] = data_dict["scores_range"][0]
    #     heatmap["zmax"] = data_dict["scores_range"][1]

    # Tweak to increase contrast of plot
    heatmap["zmin"] = bin_vals.min()
    heatmap["zmax"] = bin_vals.max()

    layout = go.Layout(title=title, xaxis=dict(title=xtitle), yaxis=dict(title=ytitle))
    figure = go.Figure(data=[heatmap], layout=layout)

    return figure
Would that be an easy change or should it be changed in the explanation object? Or is there a reason not to change this?
Hi @bverhoeff,
Thanks for your numerous thoughtful questions, and for being a fan of the package! Funnily enough, we used to scale each plot independently in the earliest releases of interpret (exactly as your sample code describes). However, the current colormap range on the heatmap is determined by the min/max across all possible plots (including main effects).
We made the switch because we noticed many users had a tendancy to overestimate the importance of interaction terms if every plot had bright colors -- it's easy to miss the absolute magnitude of the scale, and some users would spend lots of time reading into marginal differences (e.g. +/- 0.05).
It's possible that our correction for this is a bit too aggressive -- your example definitely shows that real detail is easy to miss in our current scaled version. We're still brainstorming the best way to address this -- maybe we can have a fixed scaling for the main effects, and a separate (but still fixed) scaling across the pairs? That way relatively important pairs still get high contrast, but hopefully unimportant ones would stay relatively muted. Any thoughts on this from you or other users would be appreciated!
-InterpretML Team
Ah, I understand. Your in-between suggestion, separating the mains and the pairs, might be best of both worlds. Thanks for the answer!
Tried it with separate bounds for interactions, a bit hacky:
Code at line 1111 interpret/blob/develop/python/interpret-core/interpret/glassbox/ebm/ebm.py
        # Obtain min/max for model scores
        lower_bound = np.inf
        upper_bound = -np.inf
        lower_bound_inter = np.inf
        upper_bound_inter = -np.inf
        main_count = len(self.feature_groups_) - self.interactions
        for feature_group_index, _ in enumerate(self.feature_groups_):
            errors = self.term_standard_deviations_[feature_group_index]
            scores = self.additive_terms_[feature_group_index]

            if feature_group_index < main_count:
                lower_bound = min(lower_bound, np.min(scores - errors))
                upper_bound = max(upper_bound, np.max(scores + errors))
            else:
                lower_bound_inter = min(lower_bound_inter, np.min(scores))
                upper_bound_inter = max(upper_bound_inter, np.max(scores))

        bounds = (lower_bound, upper_bound)
        bounds_inter = (lower_bound_inter, upper_bound_inter)

        print(bounds)  # just checking
        print(bounds_inter)
(obviously need to use bounds_inter at lines 1213 and 1223 too)
So I removed the errors from the calculation of ranges of interactions and then it looks like this, slightly more contrast:

If you don't remove the errors then the range is actually wider than main features! Apparently the errors of the interactions are pretty large..
This solution would be fine for me:)
Hey @bverhoeff, thank you so much for using Interpret! I am Jay Wang, a research intern at the InterpretML team. We are developing a new visualization tool for EBM and recruiting participants for a user study (see #283 for more details).
We think you are a good fit for this paid user study! If you are interested, you can sign up with the link in #283. Let me know if you have any question. Thank you!