Ridiculous memory costs
Seemingly randomly, the amount of memory used by Safari will jump to ridiculous levels.
I usually have 20 or more tabs open, but safari memory usage is 2 GB at most. Then, the computer will suddenly become slow, and it turns out safari is using more that 13 GB of memory.
This image illustrates it well. The green and red bar at the bottom is memory usage over time.
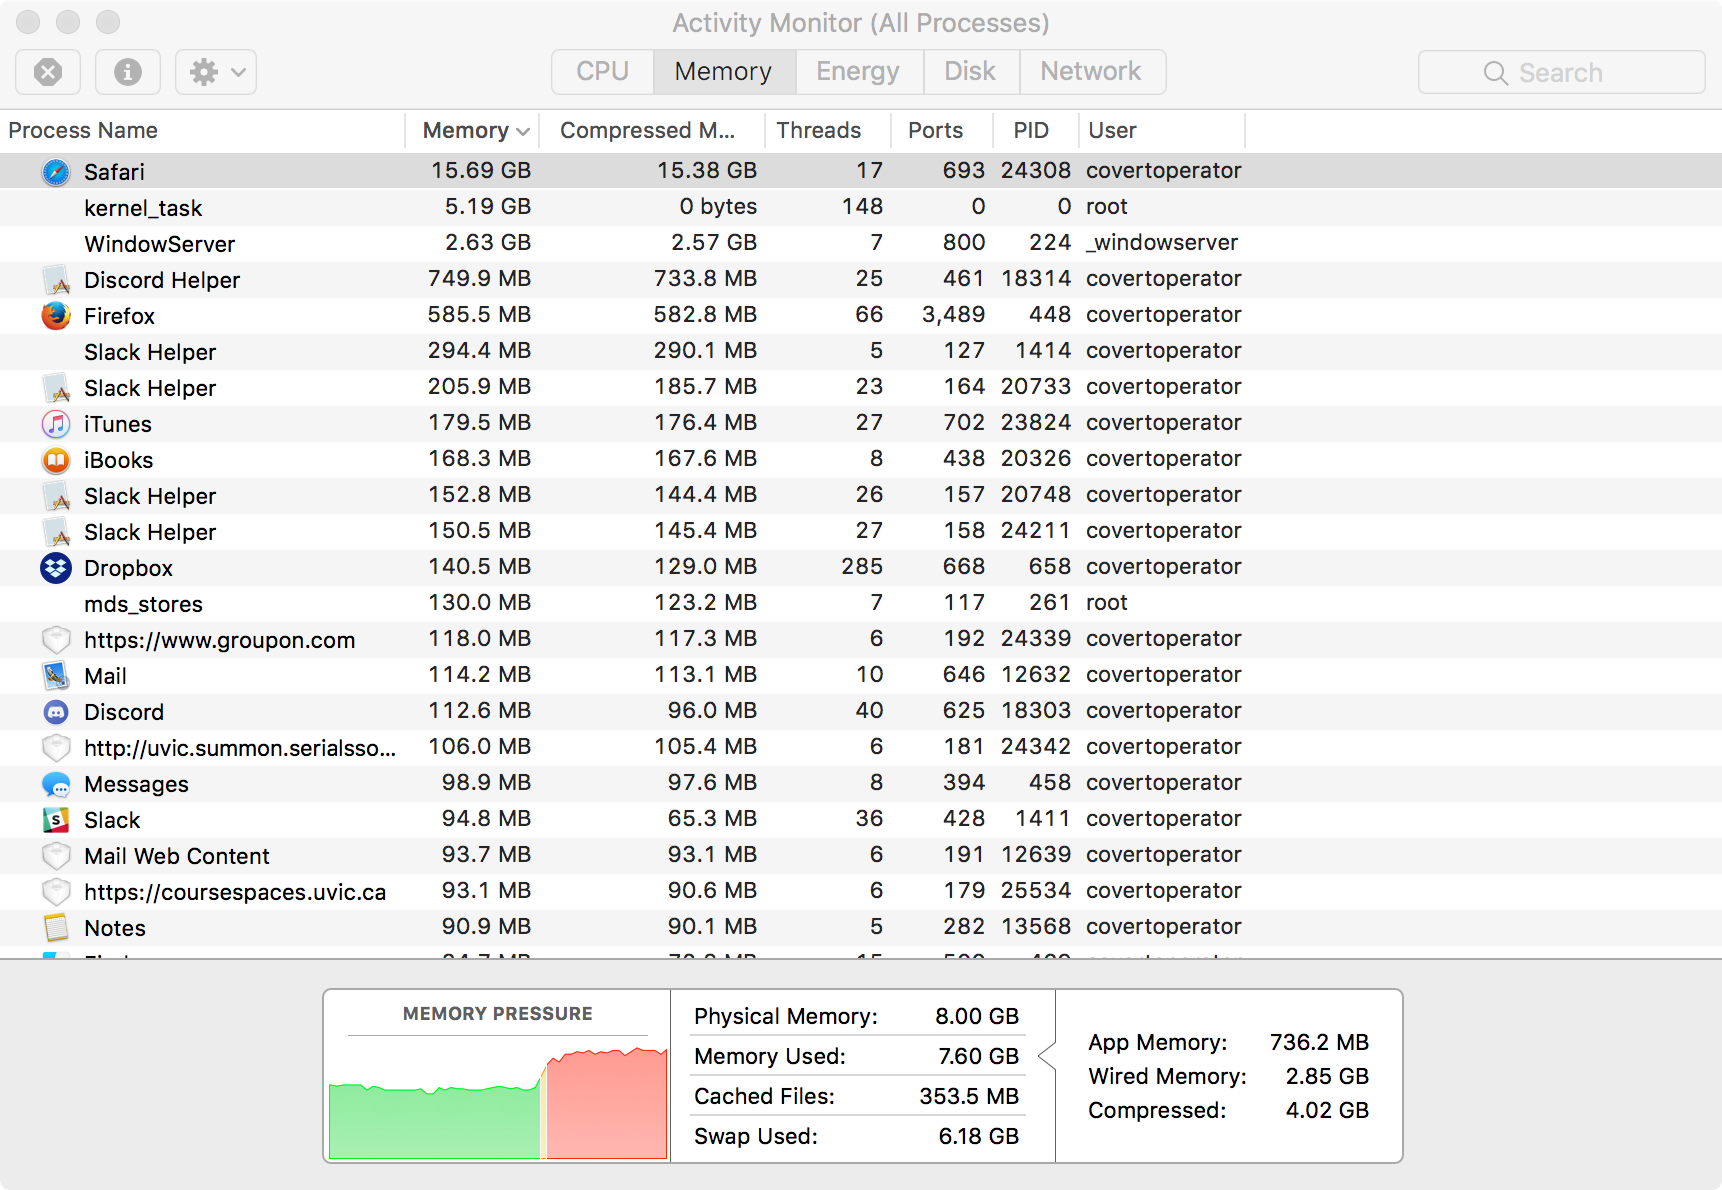
It’s a very sudden jump, not a slow buildup. I have no idea what could be the cause. If it helps, Safari is unable to Quit after this has happened (requires a force quit). It will even continue operating, albeit slowly, after recieving the Quit command.
On Nov 8, 2017, at 11:25 AM, disrupted [email protected] wrote:
you think JSBlocker is leaking?
— You are receiving this because you authored the thread. Reply to this email directly, view it on GitHub https://github.com/infernoboy/JavaScript-Blocker-5/issues/24#issuecomment-342930893, or mute the thread https://github.com/notifications/unsubscribe-auth/AUQCBhevMgcEtJ1-IiO489qkXA2h5xOyks5s0gAPgaJpZM4QW2Gp.
Unfortunately Safari doesn't offer a way to examine memory used by extensions. Does the issue persist with a clean install? You can check by opening the Settings menu and creating a backup first, then Restore Defaults.
I have exact the same issue. In my case Safari running out of memory around 38Gb (I have physical 16Gb - MBP 2016). I checked with JSBlocker installed and no other extensions. Same tabs opened in SafariTechnologyPreview without JSB - no memory leaks at all. Sometimes it happens the same day as Safari starts but more common to get a spinning beach ball in the next 2-5 days. Also I noticed not so smooth scrolling when JSB running for a couple days. Switching to discrete graphics has no effect.
I tend to see it happen in the next two minutes after brining my computer out of sleep mode. It has happened in other situations, but that is the most common.
On Jan 2, 2018, at 3:55 PM, macstalker [email protected] wrote:
I have exact the same issue. In my case Safari running out of memory around 38Gb (I have physical 16Gb - MBP 2016). I checked with JSBlocker installed and no other extensions. Same tabs opened in SafariTechnologyPreview without JSB - no memory leaks at all. Sometimes it happens the same day as Safari starts but more common to get a spinning beach ball in the next 2-5 days. Also I noticed not so smooth scrolling when JSB running for a couple days. Switching to discrete graphics has no effect.
— You are receiving this because you authored the thread. Reply to this email directly, view it on GitHub https://github.com/infernoboy/JavaScript-Blocker-5/issues/24#issuecomment-354907071, or mute the thread https://github.com/notifications/unsubscribe-auth/AUQCBqnIchE3DcXIi27rtdoBQxg197Ysks5tGsIPgaJpZM4QW2Gp.
@covertoperator
I tend to see it happen in the next two minutes after brining my computer out of sleep mode.
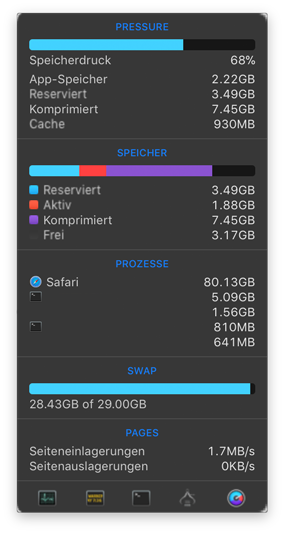
Could be related to sleeping. Configured my Mac to use Hibernate mode, and after some Hibernate-cycles, Safari uses up to 80GB of virtual memory. By disabling JSB memory usage drops under 1GB.
I'm also seeing a rather sudden increase of memory with version 5.2, which is so high that the CPU then spends most of its time swapping ram to disk. Restarting Safari and reloading the previously opened tabs solves the issue (for a while). I cannot attribute the issue to a single page opened, and also not to the number of opened tabs – it's rather something that happens after a few hours/days of Safari running.
E.g. right now (with only Safari and Mail running), swap jumped from a constant 2GB to 4GB within two minutes, and 10 minutes later it was at 9GB (while typing an email, having Safari in the background).
(The 5.3 version prints an error message when attempting to install it, so I cannot comment on if this issue has been solved yet)
Version 5.3.0 does still have the issue as I cannot isolate it. For me personally, it happens so rarely that by the time I notice, Safari is too unresponsive for me to examine what's going on. Has anyone continued to experience this on 10.13.4?
I'm still seeing this on 10.13.4 on a daily basis. I saved a spindump and just sent it to the the email address you provided on your github user page, hoping that helps with the analysis.