Overlay `LineChart` with View
I need to do something like this. Is it possible? I've tried with position absolute and zindex but none has work
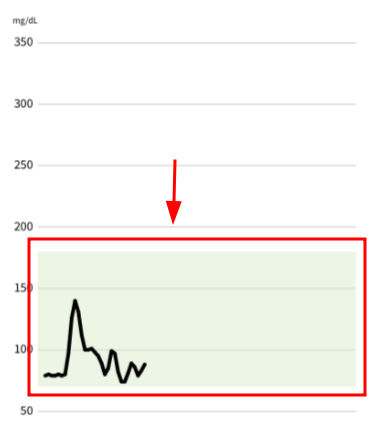
hey @gabrielew can you please guide me how you use the unit on top om y-axis rather than the unit showing with each y labels, I need to do this same just like you did
You can add invisible data to represent it.
datasets: [ { key: 'rateist', data: ratelist, color: (opacity = 1) => rgba(152, 152, 152, ${opacity}), strokeWidth: 3, withDots: true, }, // Virtual data in the range you want to represent { key: 'dummy-data', data: [_low, _max + _gap], <---- bottom and Top color: () => rgba(255, 0, 0, 0), strokeDashArray: [0, 1000], withDots: false, }, ]