Make groupby visualization selectable on explorer tab
Use Case
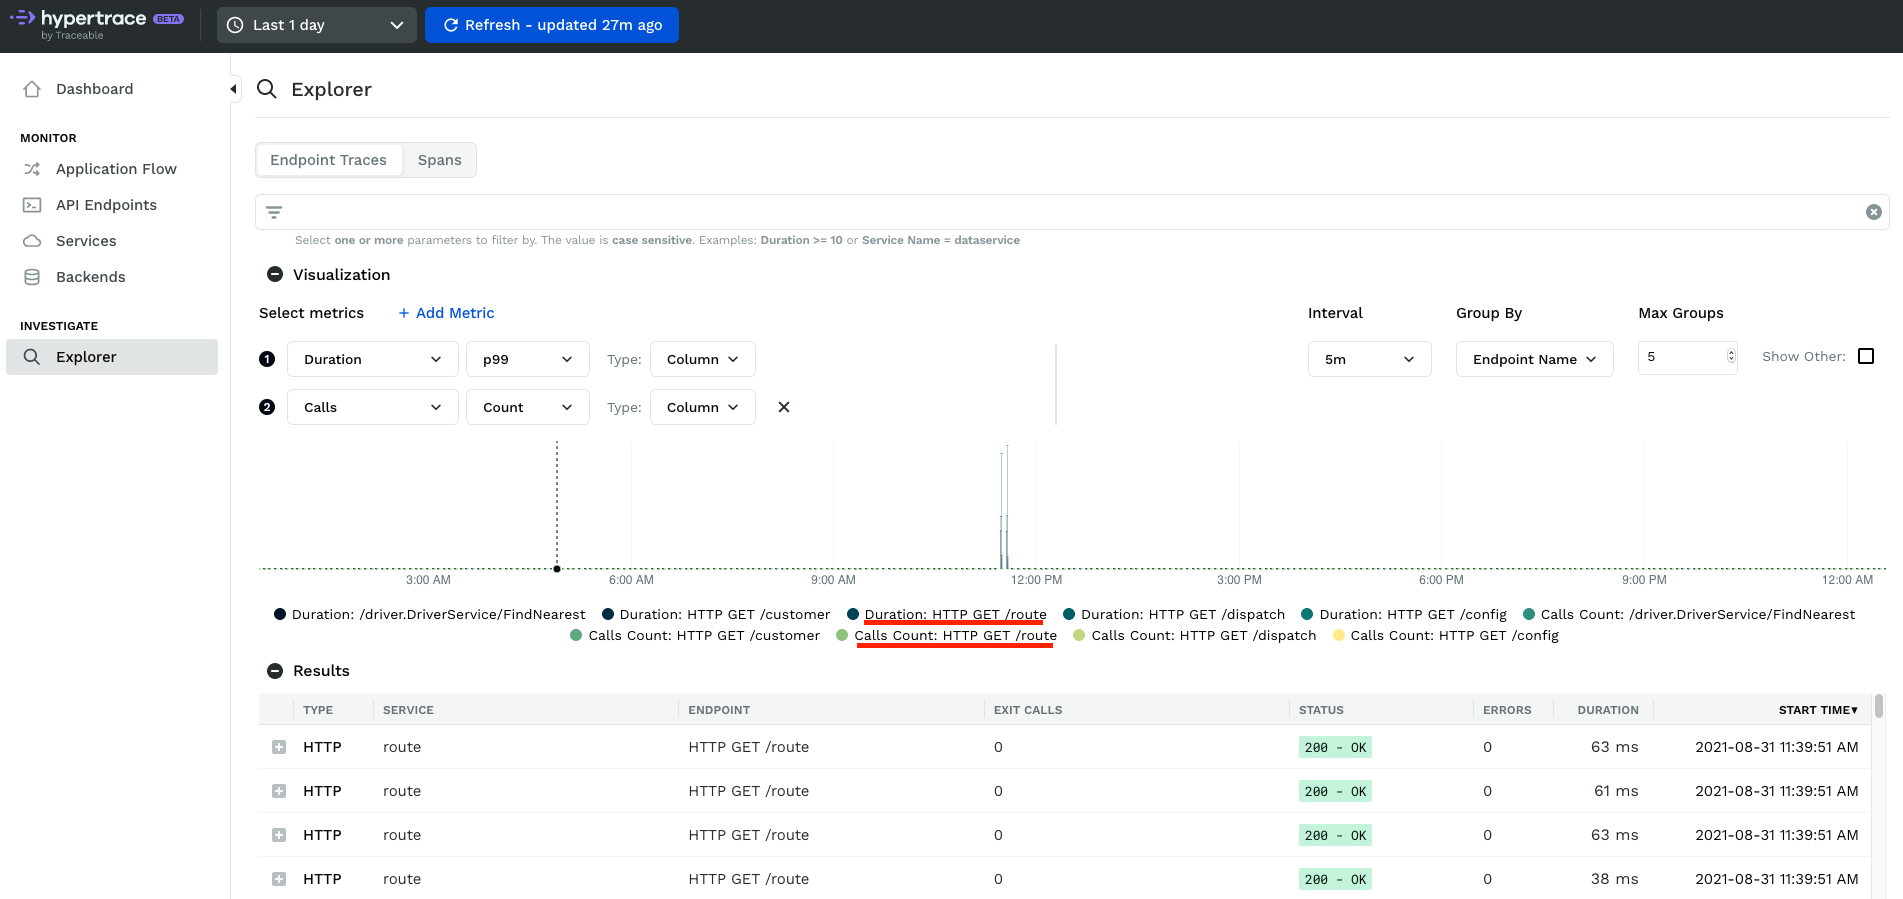
I wanted to correlate the duration vs calls count for the route HTTP GET /route¸in the above screenshot. This is very difficult in the current UI due to multiple visualizations from the different groupby values
Proposal
I should be able to select individual metrics in the above visualization. For example in the above screenshot, I should be able to select calls count and duration ONLY for HTTP GET /route
@aaron-steinfeld @JBAhire @itssharmasandeep @anandtiwary Plan to pick up this task as the next one. your thoughts?
Is this ask here to temporarily toggle series on/off? I agree we should add that. The use case being described however doesn't sound like a group by one at all. Filtering to HTTP GET /route would give the visualization I believe is being asked for. Group by isn't needed for that use case, although including it as it is here would still end up in the same visualizations I expect.
@aaron-steinfeld How do I get started with this toggle series on/off? I hope CartesianLegend class is the one for legend implementation. Add click listener, to legend, then hide/show series after and reduce the opacity of the invisible series legend. is this correct?
@aaron-steinfeld How do I get started with this toggle series on/off? I hope CartesianLegend class is the one for legend implementation. Add click listener, to legend, then hide/show series after and reduce the opacity of the invisible series legend. is this correct?
Yeah, I'd probably add an observable to the legend that outputs the selected series. On legend entry click, legend component can reduce opacity of other series and emit the selected series. The chart can react to that and set the opacity on the rendered series appropriately.