Control resolution of rasterized plots
I'm using ds.hvplot.quadmesh to project and visualise a heatmap of geospatial data. Due to the size of the data, I have to set rasterize=True. As far as I'm aware (and I may be wrong), the only way to control the spatial resolution of the rasterization process is to specify the height and width parameters in the arguments to the plotting function. This has the undesirable effect of making all the figure element (labels, bokeh widgets, etc) super small. It would be preferable if there were a way to control the downsampling process without changing the actual size of the plot. Is there something I'm missing or am I on to something? Cheers!
FYI, here are my arguments to the quadmesh call:
    p = ds.hvplot.quadmesh(
        x='lon', y='lat', z=variable,
        crs=crs, projection=projection,
        width=600, height=540, cmap=cmap, dynamic=False,
        title=title,
        legend='bottom', global_extent=False,
        project=True, rasterize=True,
    )
The underlying rasterize() function provides those arguments, but I don't think they are exposed in hvPlot. To get around that, you can try code like this sketch:
from holoviews.operation.datashader import rasterize
p = rasterize(ds.hvplot.quadmesh(
        x='lon', y='lat', z=variable,
        crs=crs, projection=projection,
        width=600, height=540, cmap=cmap,
        title=title, legend='bottom',
        global_extent=False, project=True,
    ), plot_height=300, plot_width=300)
Thanks @jbednar! This almost worked off the bat - I think the arguments to rasterize should just be height and width (based on digging through the classes on http://holoviews.org/_modules/holoviews/operation/datashader.html - from the definition of _get_sampling in ResamplingOperation which quadmesh_rasterize inherits from). By making these width and height values a multiple of those passed into ds.hvplot.quadmesh, I can control the resolution.
One issue is that this loses the hvPlot hover tool for the pixel values. Can I add this back manually using the returned p object somehow?
I've answered my own question above by looking further into the holoviews documentation. I just have to call p.opts(tools=['hover']) on the plot object. My final function call looks like this:
    p = rasterize(
        ds.hvplot.quadmesh(
            x='lon', y='lat', z=variable,
            crs=crs, projection=projection,
            width=width, height=height,
            cmap=cmap, dynamic=False,
            title=title, hover=True,
            geo=True,
            legend='bottom', global_extent=global_extent,
            project=True,
        ),
        expand=False,
        height=height*resolution_fac, width=width*resolution_fac
    ).opts(tools=['hover'])
Where resolution_fac controls the resolution of the quadmesh.
I'll leave this issue open in case a hvplot developer thinks something like resolution_fac is worth including explicitly in hvplot. But otherwise I'm satisfied so feel free to close.
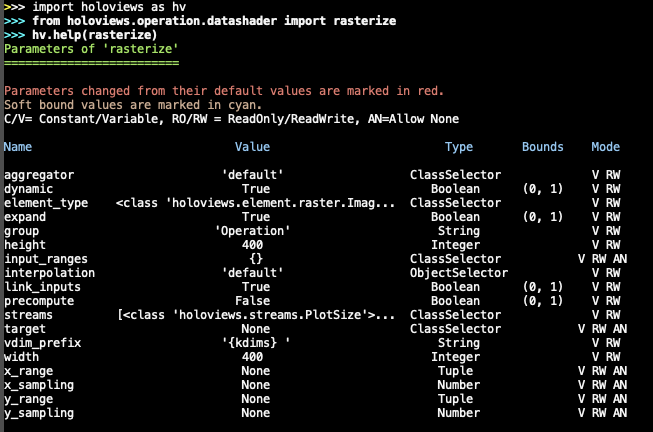
Ok, good; height and width are better names anyway; it's the underlying Datashader code that needs the long version. In future, you shouldn't normally have to resort to tracing through the code; just do hv.help(rasterize):
I'll transfer this issue to the hvPlot repository, where it has become a request for the ability to control the rasterize command using hvPlot syntax. I can think of a few alternatives for doing so, and feel free to vote on them or explain why one or the other of them would be better for how you are using things:
- hvPlot calls could accept an argument
rasterize_args, a dictionary of key:value pairs that would be supplied as-is when hvPlot callsrasterize, after its own arguments. Pros: Provides the full power ofhv.operation.datashader.rasterize(), including all the various arguments shown above, within the hvPlot syntax. Cons: Full usage requires looking up the HoloViews documentation forrasterize, at which point maybe people should just be using that operation directly. - hvPlot calls could accept arguments
raster_widthandraster_height, specifically controlling the rasterized plot's width and height. Pros: Addresses this specific need directly without any recourse to HoloViews docs. Cons: Doesn't address any otherrasterizearguments likex_samplingandinterpolation, though those may already have been added to hvPlot (not sure). - hvPlot calls could accept an argument
rasterize_factorthat is multiplicatively applied to the plot's native height and width to get the rasterization resolution. Pros: One new argument rather than two. Makes it simple to express "I want a lower resolution than usual" without fiddling with specific widths and heights. Cons: Only addresses this one use case.
BTW, you no longer need dynamic=False in your call above; I believe that option applies only when rasterizing or datashading.
Hmm, this is a bit of a dilemma. 3 would save people time on searching through HoloViews documentation while adding some nice additional functionality (e.g. reducing resolution to send a plot over email, etc). Having to manually set the height and width of the underlying raster (e.g. through option 2 or 1) is a bit unintuitive for new users. The extra flexibility afforded by 1 would be useful too, though.
3 would get my main vote, but 1 would be a nice plus (with a link to the appropriate HoloViews documentation). I guess you would have to ensure users didn't supply both rasterize_factor and rasterize_args={'height': ..., 'width': ... at the same time though.
I'd be quite happy to add option 1 and 3, that said I'm hoping we can find a better name for both.
I run into this daily and I am not sure how to keep the rerasterization on zoom/pan of simply setting rasterize=True while avoiding the "half the dataset disappears" bug. Mr. @tom-andersson did you ever get it to work fully and not just for a static image sir?
Seemingly fixed or much better using this post thanks to @zxdawn
Ha, project before rasterizing like holoviz/geoviews#483 can fix it!
import xarray as xr
import geoviews as gv
import cartopy.crs as ccrs
import geoviews.feature as gf
from holoviews.operation.datashader import datashade

gv.extension("bokeh")

ds = xr.tutorial.open_dataset('rasm').load()

gvds = gv.Dataset(ds.isel(time=0))

mesh = gvds.to(gv.QuadMesh, kdims=["xc", "yc"], vdims=['Tair'])

datashade(gv.project(mesh, projection=ccrs.NorthPolarStereo()),
          precompute=True,
          cmap='Spectral_r',
          dynamic=True,
         )*\
gf.coastline.opts(width=500, height=500,
                  tools=['hover'],
                  projection=ccrs.NorthPolarStereo(),
                 )

Which makes me wonder if it is possible to have this fix as the default in hvplot Mr. @maximlt and Mr. @Hoxbro ?
I see no problem in having better support for different geo-projection and datashading.
Though, I don't think this will be added in the near future.
I do not want to necessarly project Mr. @Hoxbro . I run into this issue using the native dataset as well and the only hack I found is the one mentioned above where I project before I rasterize explecitely. Ideally when I use
ds.hvplot.quadmesh( ... , rasterize=True)
I would be able to zoom and pan without half the dataset disappearing. At the moment it is a major bug in my opinion since it makes hvplot unusable for most atmospheric and oceanic forecast models.
half the dataset disappearing
@itsgifnotjiff , can you please open a separate issue about whatever problem you are referring to? This issue is about how to control rendering resolution.
For this issue, also consider the pixel_ratio parameter for rasterize, which lets you increase or decrease the resolution without having to worry about aspect ratios. See https://holoviews.org/user_guide/Large_Data.html for examples.