Polar plots
I'm currently using DPG for some side projects and I would love to have the posibility to add polar plots to my GUIs (since I work a lot with angles an positioning relative to angle / distance pairs).
It will be pitch perfect either with a modification of the current plot widget or by implementing a brand new one capable of working with polar coordinates.
Thank you in advance!!
+1 I saw a really nice polar plot here. @hoffstadt, do you know where is this plot from or how to reproduce it?
I also would like to know if there is a good way to draw polar plots. Are there any updates on this issue?
In case anyone comes across this, I was able to draw polar plots using the Drawing API. I just converted my polar coordinates into cartesian coordinates and drew the polar plots using draw_polyline.
@jackthomas818 Thanks for updating! Do you have any repo using that code? I would like to see how it turned out.
@jmoraispk
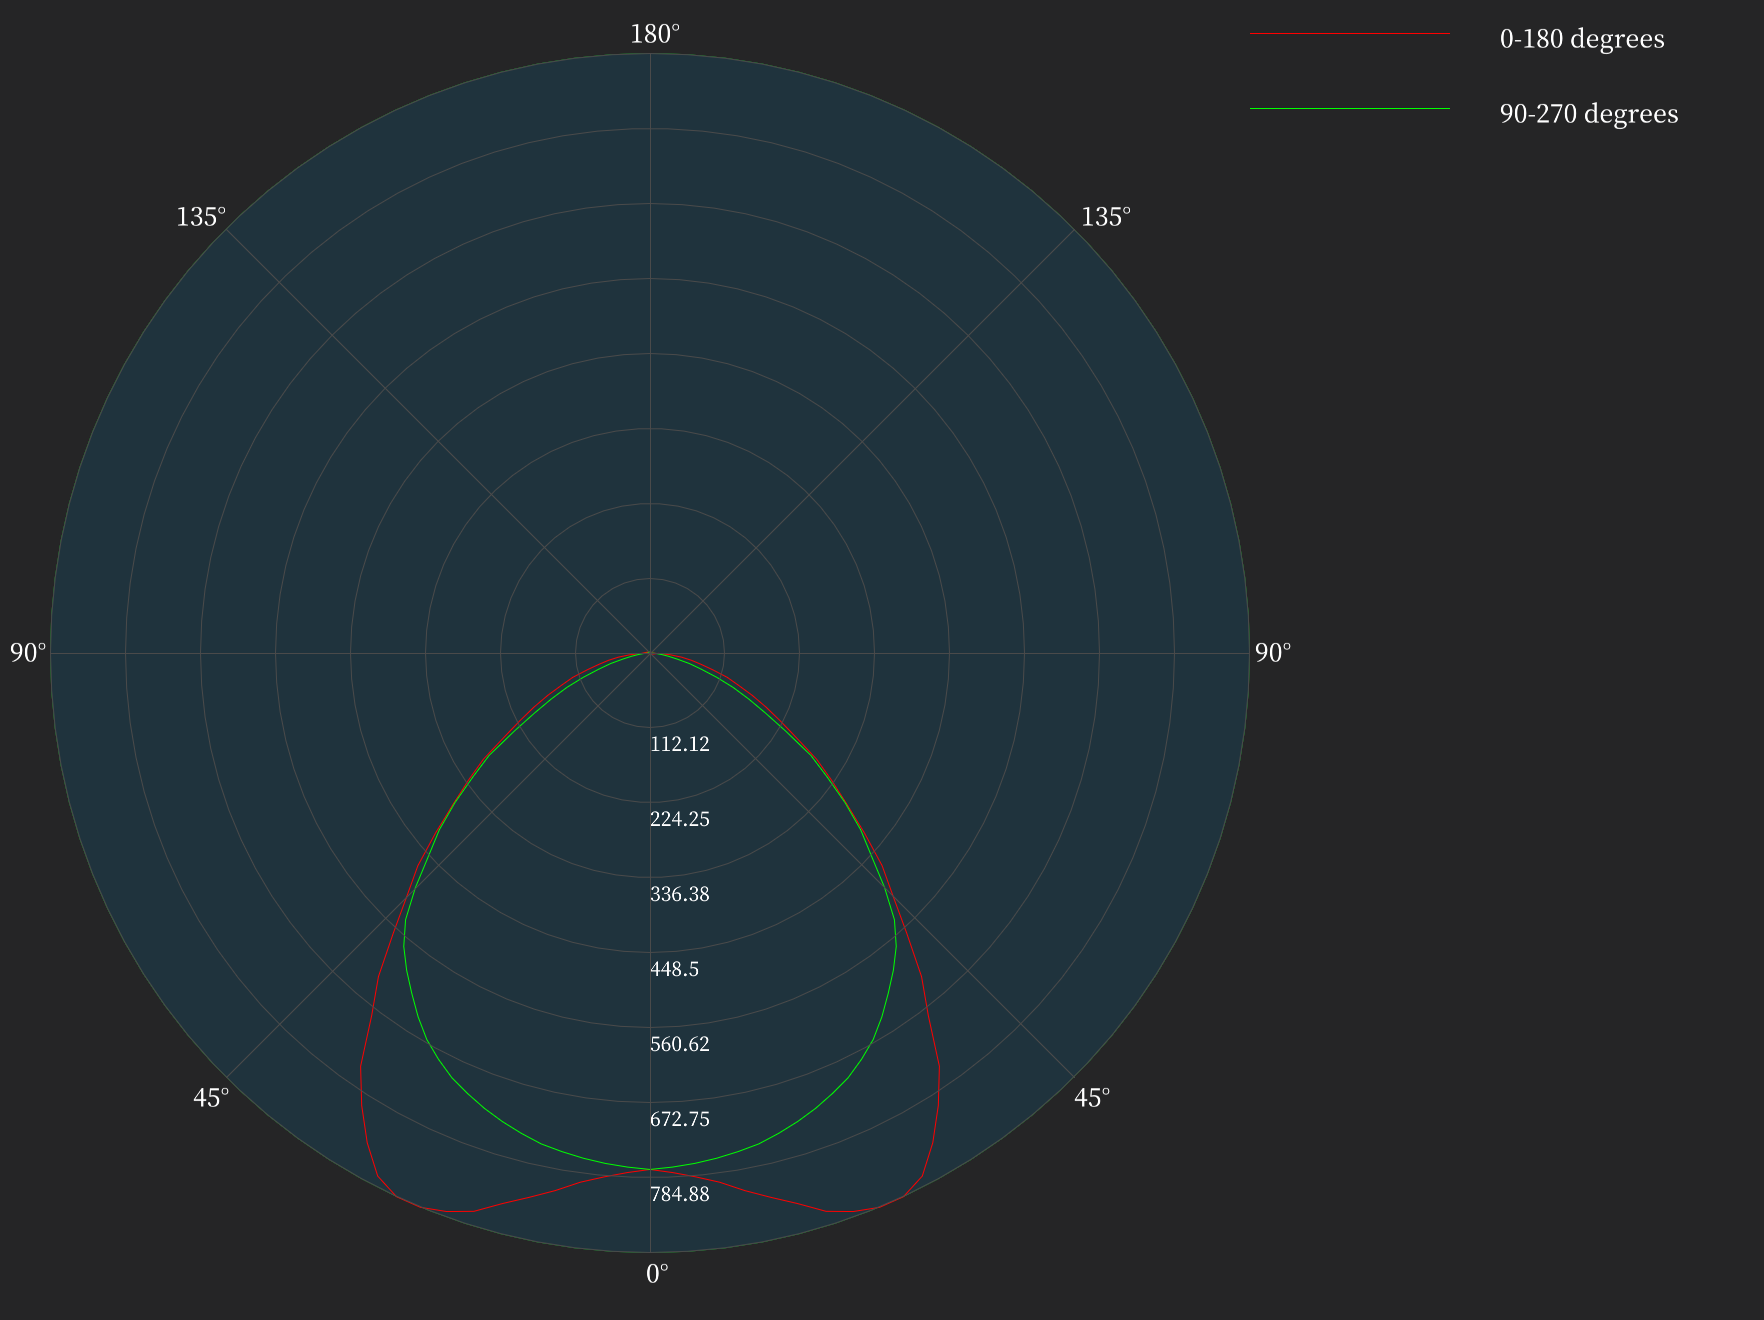
Unfortunately I cannot share the repository due to being proprietary code, but I can share a polar plot that was generated.
@jackthomas818
Thanks!! That's quite a good polar plot! For sensor patterns, like antennas or microphones, this is great!
Could you perhaps post just the plot part here as a code block in case someone else bumps into this in the future?
@jmoraispk Here is some code that draws a simple circle in a polar plot.
from dearpygui.dearpygui import *
import numpy as np

create_context()

with window(label="Polar Plot"):

    with drawlist(width=1000, height=1000):

        # size of polar drawing
        circle_radius = 400

        # drawing a simple circle
        r = 100
        theta = np.deg2rad([i for i in range(0, 360, 1)])

        # converting polar coordinates to cartesian
        points_x = r * np.cos(theta)
        points_y = r * np.sin(theta)

        points = [list(point) for point in list(zip(points_x, points_y))]

        with draw_node(tag="polar_graph_main"):
            draw_circle(
                [0, 0],
                circle_radius,
                color=[0, 255, 0],
                fill=[31, 51, 61],
            )
            # polar grid circles, can be any number
            ncircles = 8
            with draw_node():
                draw_polyline(points, color=[255, 0, 0])
                for i in range(0, ncircles):
                    draw_circle(
                        [0, 0],
                        circle_radius / ncircles * (i + 1),
                        color=[74, 74, 74],
                    )
                # polar grid lines
                draw_line(
                    [0, -circle_radius],
                    [0, circle_radius],
                    color=[74, 74, 74],
                )
                draw_line(
                    [-circle_radius, 0],
                    [circle_radius, 0],
                    color=[74, 74, 74],
                )

                draw_line(
                    [
                        -circle_radius * np.cos(np.deg2rad(45)),
                        circle_radius * np.sin(np.deg2rad(45)),
                    ],
                    [
                        circle_radius * np.cos(np.deg2rad(45)),
                        -circle_radius * np.sin(np.deg2rad(45)),
                    ],
                    color=[74, 74, 74],
                )
                draw_line(
                    [
                        -circle_radius * np.cos(np.deg2rad(135)),
                        circle_radius * np.sin(np.deg2rad(135)),
                    ],
                    [
                        circle_radius * np.cos(np.deg2rad(135)),
                        -circle_radius * np.sin(np.deg2rad(135)),
                    ],
                    color=[74, 74, 74],
                )

    # this moves the graph so that it is entirely visible in the viewport
    apply_transform(
        f"polar_graph_main",
        create_translation_matrix([circle_radius + 50, circle_radius + 50]),
    )
create_viewport(title="Custom Title", width=1920, height=1080)
setup_dearpygui()
show_viewport()
start_dearpygui()
destroy_context()