logseq-chartrender-plugin

logseq-chartrender-plugin copied to clipboard
Feature Request - Rendering multiple charts in one
My case :
I'm looking for a way to draw Pareto Charts into Logseq
General :
I've found no way to draw multiple lines or to combine a line chart and a bar chart into a single chart
Question :
Is it possible to allow users continue describind charts next to the first one and render them into the same drawing ?
i'm thinking something like that : /chart render
- line black 500
- A
- 50
- 60
- 30
- B
- 30
- 44
- 94
- A
- bar yellow 500
- C
- 55
- 44
- 99
- D
- 98
- 45
- 55
- C
Thanks for considering this feature request and for your already good tool you've made here
Illustration :
This is the kind of charts I try to make
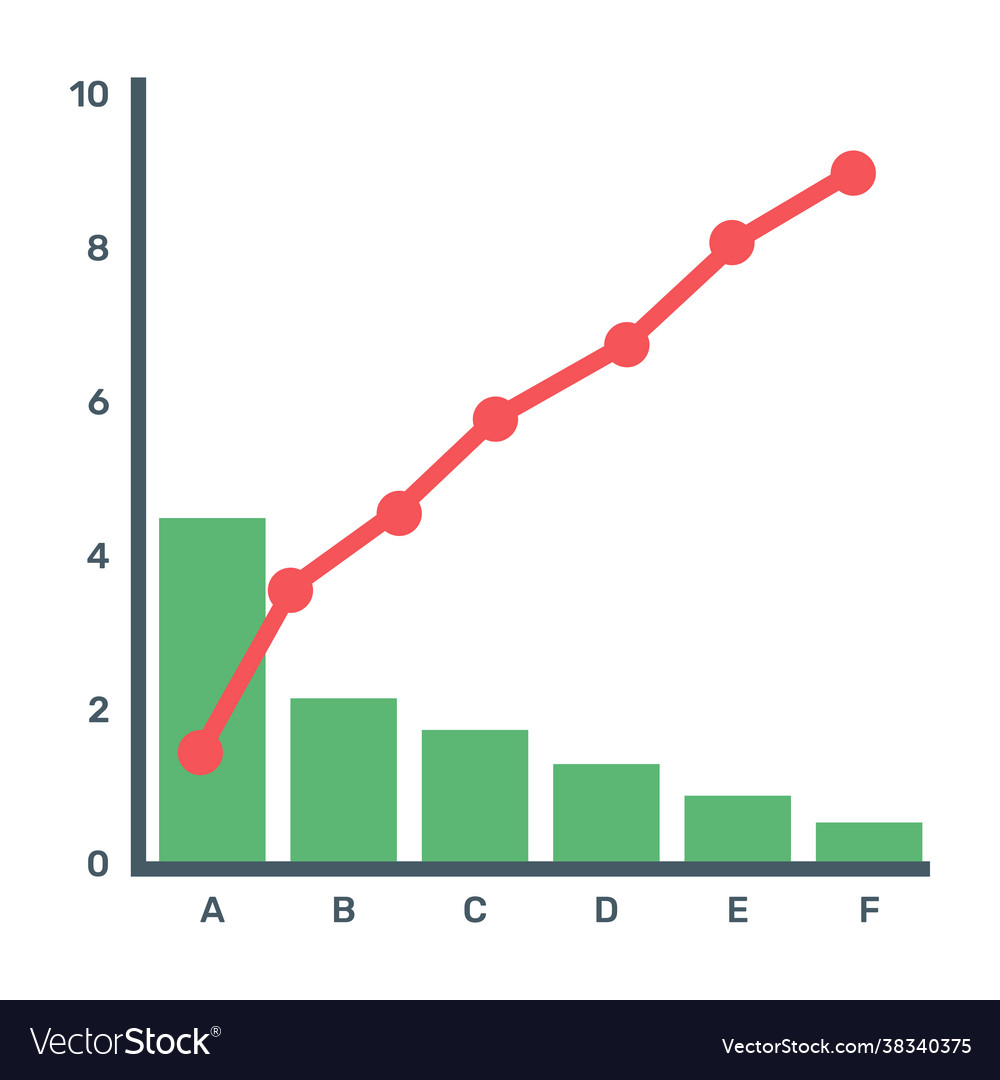 royalty free img from vectorstock.com