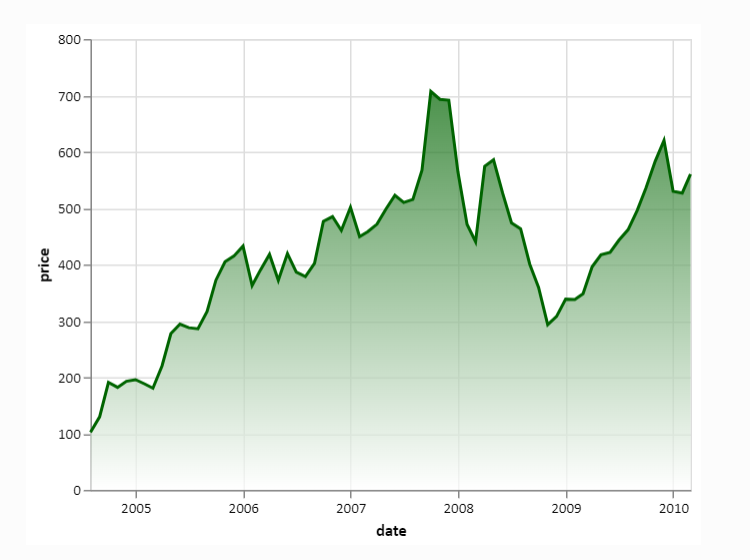
Area chart with gradient
Is there any way to achieve a gradient in the filling of an area chart?
I have not been able to find anything in the docs.
If not, how feasible would it be to add this feature? I think it greatly improves the aesthetics of area charts.
Thanks a lot in advance!
It is not possible, and I do not know if it can be implemented cleanly (without trying).
If I am understanding the philosophy, the code should look something like this right?
(
ggplot(df, aes(x='date', y='value', alpha='value'))
+ scale_alpha(range=(0, 1))
+ geom_area()
)
If I am understanding the philosophy, the code should look something like this right?
(
ggplot(df, aes(x='date', y='value', alpha='value'))
+ scale_alpha(range=(0, 1))
+ geom_area()
)
Maybe or maybe not only that. The gradient may come from the alpha or from the fill (the continuous colour range) or even both. The key to implementing though, is that it should be supported by the underlying drawing system; that is the hard part!