Tutorial / Examples for automatic layouts
A jupyter notebook tutorial for automatic layouts would be super useful, along with the graphs rendered.
Hi @rajpratyush - in general, I think yes (correct me if wrong @dwaynepryce) but I saw you were also interested in #586 and #625. I would recommend working on those other two before this one, because this will be a lot more work, and would require 1. you learning the automatic layout tools in the library and 2. us deciding what dataset(s) we would want to showcase for the automatic layouts tutorial.
Happy to discuss more if you are interested and want to get familiar with these tools!
Calling these functions is super easy - the big question is what graph shows us a good, reasonable layout.
An example used in other layout algorithms is an edge list based on a Yeast genome dataset (the link in the openord README is no longer valid, but they did commit the yeast edge list to https://raw.githubusercontent.com/SciTechStrategies/OpenOrd/master/examples/serial/yeast.sim so we could probably use that at as well).
All I did was download that file, replaced \t with ,, then ran python -m graspologic.layouts n2vumap --edge_list yeast.sim --image_file yeast.png to get
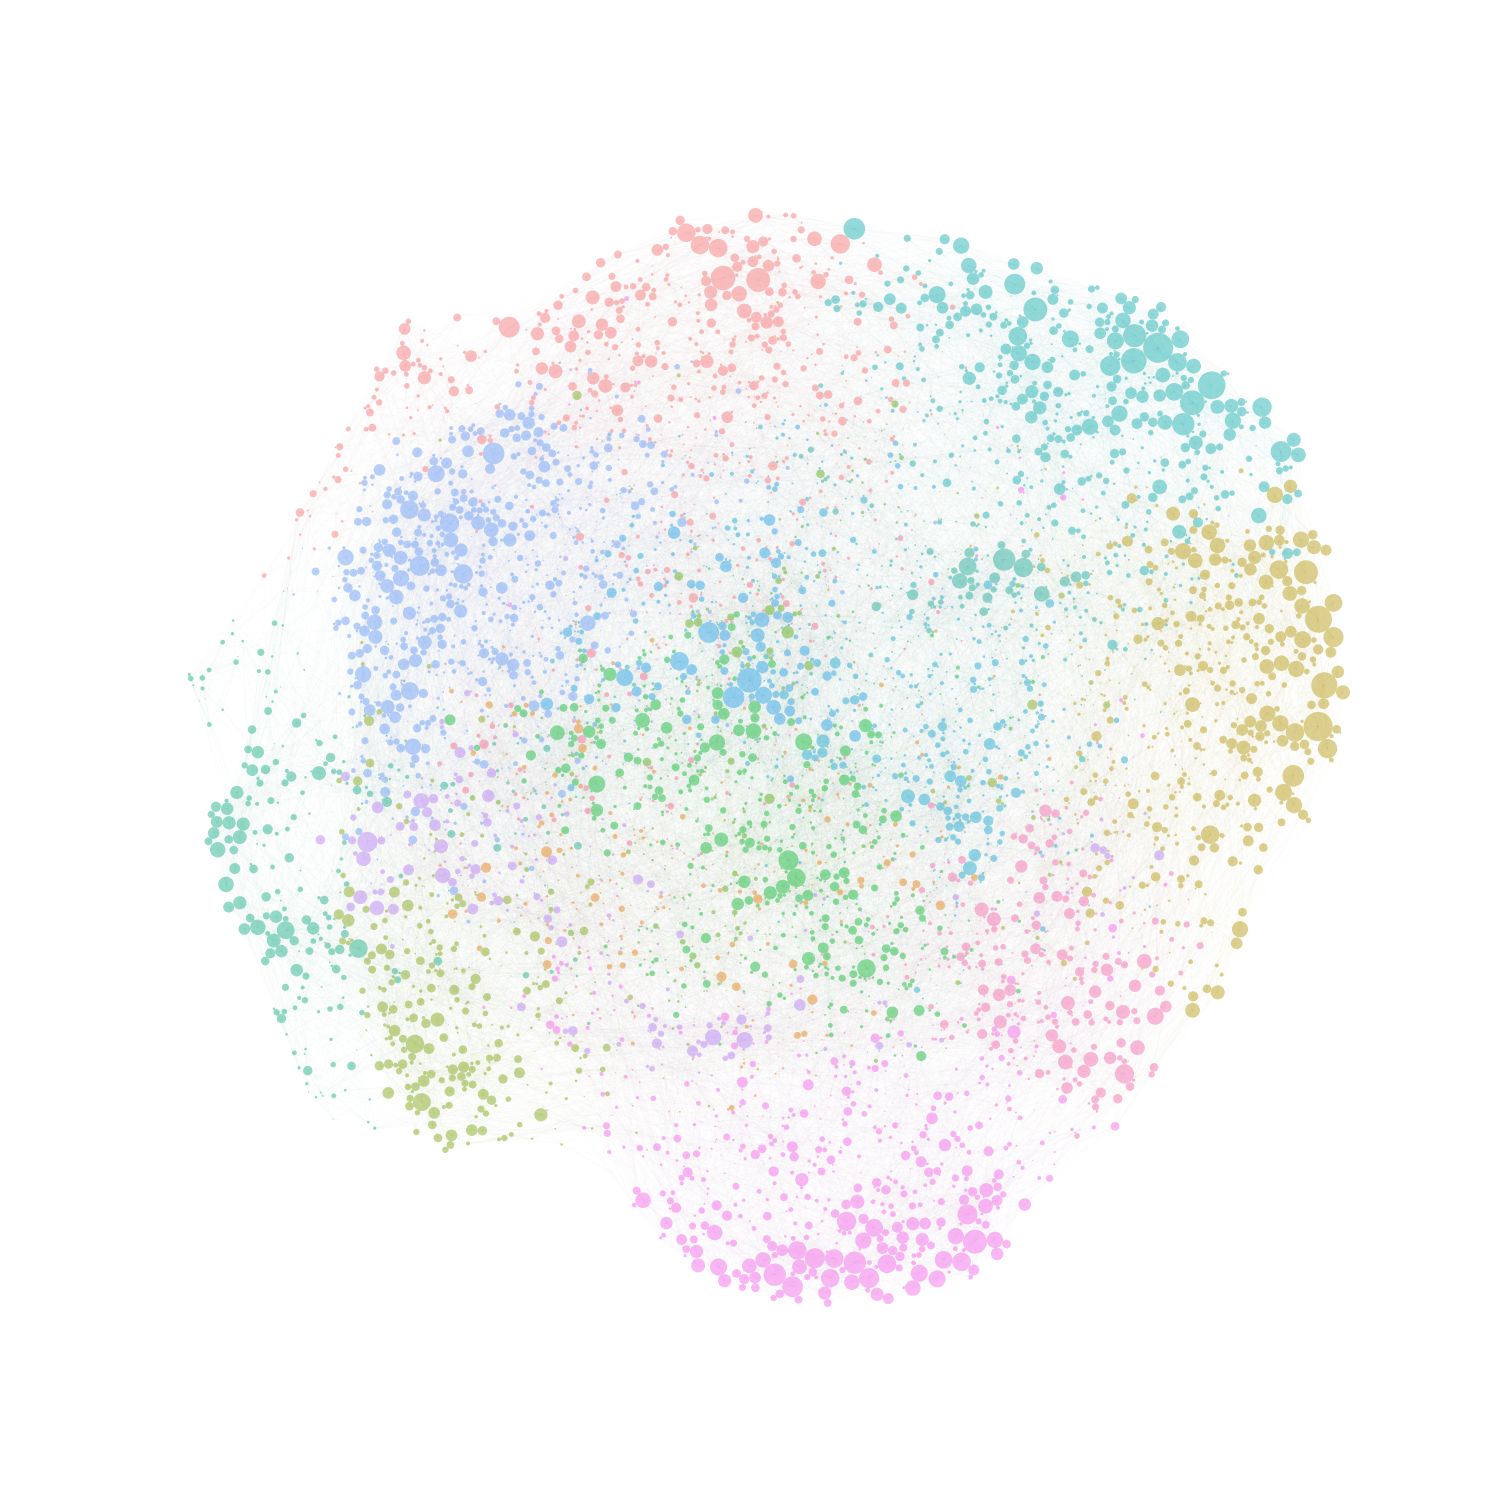
Which is at least fairly visually appealing.
Better than this simple example of using it via the command line would be also using it via library code and turning the edges back on between nodes and trying to find an opacity that also looks pretty good. You could then use the show_graph function in graspologic.layouts.render to display them in the Jupyter notebook and play around with some things like maybe updating the colors from being partition based to some sort of sequential colors based on degree centrality or something.
There's a lot of opportunity for playing around with this, if you're interested!
sure @bdpedigo i will work on other so two so that i get familiar with the codebase before moving ahead with higher order problems
I'm going to defer to @dwaynepryce on whether we know what we want for this tutorial to the extent that you could run with it?
@dfrancisco1998 - make sure you message @bryantower with all of your questions. His implementation was the original one (when I merged, I squashed everything and all of his commits were lost, but trust me when I say he is the progenitor of this approach and most questions should go directly to him.) If there are questions about the color scheme generation or partition generation process, hit me up and I'll be glad to help.
@bryantower actually, if you have any publicly available data that shows off the auto layout process from beginning to end, that may be a good place to start
@dwaynepryce I am trying to use git to upload the layouts tutorial and the file is too large. Do you happen to have a smaller graph csv?
thoughts on just finding something interesting/moderately sized in http://konect.cc/ ?
@bdpedigo I did but i was having a hard time understanding how the data was laid out (despite reading the readme within the .tar) I can bring those questions to office hours tomorrow
it looks like tab separated value edgelist from the one example I looked like, e.g., source \tab target \tab weight \newline
karate club i think i could be wrong, that's just what i assumed they meant by tsv