Add ability to wrap a method in instrumentation
Describe the idea
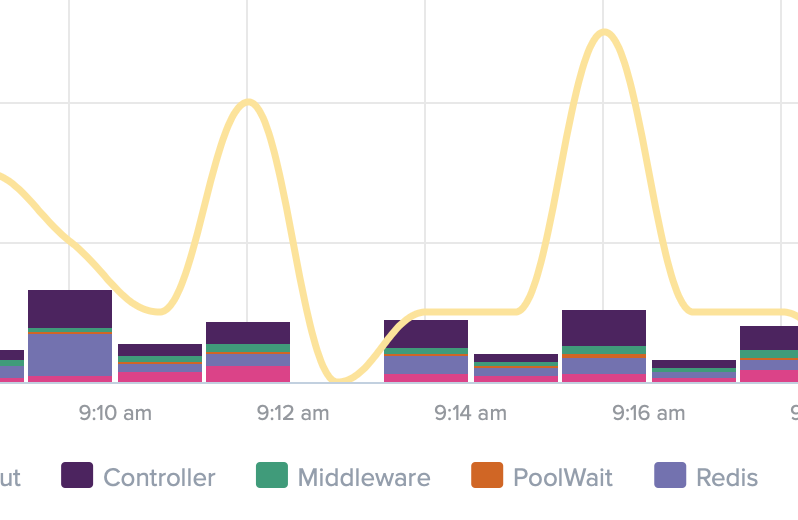
This Tweet describes how to instrument the ConnectionPool#with method in Scout, to tell how long you waited for a connection from the pool. It would be great if there were a simple way to do this with Sentry.
https://twitter.com/adamlogic/status/1390661379787534341
Why do you think it's beneficial to most of the users
The ConnectionPool gem is commonly used by both Sidekiq as well as Rails' cache store. A big source of performance issues is a misconfigured connection pool that has do not have enough connections available. A Redis command that takes less than 1ms can look like it took 100ms, if it spent 99ms waiting its turn for a connection.
The solution can be a generic one to enable easily instrumenting any pre-existing method.
Possible implementation
Both Scout and Elastic APM have a helper module you can include into any class that allows you to add instrumentation to any method. They do this by wrapping the method.
Scout Docs: https://scoutapm.com/docs/ruby/advanced-features#instrumenting-method-calls Source Code: https://github.com/scoutapp/scout_apm_ruby/blob/master/lib/scout_apm/tracer.rb
Elastic APM Docs: https://www.elastic.co/guide/en/apm/agent/ruby/current/custom-instrumentation.html Source Code: https://github.com/elastic/apm-agent-ruby/blob/main/lib/elastic_apm/span_helpers.rb
I tried to monkey patch this in, but it doesn't seem to be working correctly, and it's a bit cumbersome.
ConnectionPool.prepend(Module.new do
  def with
    transaction = Sentry.get_current_scope.get_transaction

    if transaction
      transaction.with_child_span(op: :connection_pool_with, description: "ConnectionPool#with") do
        super
      end
    else
      super
    end
  end
end)
Also, Scout's has a nice scope: true option that determines whether the contents of the block should be subtracted from this instrumentation. This is means if you have this code:
Redis.current.with do |connection| # 1ms to get a connection
  connection.set 'foo', 'bar' # 2ms
  connection.get 'something' # 5ms
end
If you do scope: true, then with says 1ms. If you do scope: false (the default), then with says it took 8ms. In this case, I only want to know the 1ms. For other methods it could be helpful to know the 8ms.
I'd love if I could write something like:
class ConnectionPool
  include Sentry::TransactionHelper
  instrument_method :with, include_children: false
end
@sl0thentr0py I think similar APIs is a must-have if we want to push tracing further. Wdyt?
I do agree that the current transaction api is kinda clunky for custom transactions/spans. I'm all for adding language specific convenience helpers if it leads to more feature adoption. Some context, adding a better custom instrumentation API has been an ongoing concern across SDKs for a while now. The major complexity for doing this generally across languages comes from async code, but we don't have that problem in ruby so we can certainly add some stuff here.
For the specific arguments, I'm not sure about the complexity that include_children entails so I'd leave that out for now.
I guess the scope thing is also convenient so we can add that.
We could have an optional op argument that gives the span an op name which would otherwise default to the method name.
I think @natematykiewicz consider include_children and scope the same thing? Just that include_children is a more explicit name.
Exactly @st0012! I was just trying to go with what felt like "Sentry" language. Since there's a with_child_span, I thought maybe include_children would be a good option. Though I guess it's actually the inverse of Scout's scope.
The basic crux of it is that Scout already instruments all of the Redis commands (get, set, etc). By instrumenting ConnectionPool#with, I'm actually creating nested instrumentation. So Scout's scope option will subtract the duration of any nested instrumentation out of this block, so that I can track how long ConnectionPool#with itself (without however long any Redis calls or any other already-accounted-for code) took.
This helps a lot when trying to break down a web request into:
Views: 8% ActiveRecord: 87% Redis: 4% ConnectionPool#with: 1%
@sl0thentr0py does Sentry core plan to support showing metrics of a custom span? like the one demonstrated in the tweet
I think these custom instrumentation will be most useful with that support.
also, under the current design, spans only record start and end time. so the time deduction for include_children needs to be done on the server side. otherwise, the span will look very weird. but to do that, we also need to add a new attribute to the span to tell Sentry to do so.
@natematykiewicz I think the custom instrumentation can be supported relatively soon. but to get what the tweet demonstrated, it'll require many Sentry core <-> SDKs collaboration. so before that, the actual outcome you'll see is an parent span that wraps around redis spans in the individual transaction page.
Totally understandable. Anything that tells me how long we're waiting on a connection pool is incredibly helpful.
does Sentry core plan to support showing metrics of a custom span?
Not that I'm aware of, currently Discover doesn't even support filtering by span.op. Pinging @getsentry/discover-n-dashboards if they have input here.
I think it's fine to just have a parent span for now and not do the include_children logic, anything more than that is a cross team collab as @st0012 said and not sure it's worth opening this box for now.
Either way, we can build this incrementally and just go with a simple helper first which only requires changes on the SDK, collect feedback and then iterate later with other teams for metrics/filtering/server side logic.
@natematykiewicz not exactly what you hoped for, but you will be able to simplify the wrapping block to
result = Sentry.with_child_span do
  # my operation
end
in this case, it'd be something like:
  def with
    Sentry.with_child_span do
      super
    end
  end
the API will be released in 5.3.0.
@sl0thentr0py @st0012
Not that I'm aware of, currently Discover doesn't even support filtering by
span.op. Pinging @getsentry/discover-n-dashboards if they have input here.
Because Spans aren't indexed there aren't any plans to add them to Discover or Dashboards. We have started doing some basic things with spans in Performance like showing the spans that account for the slowest times across transactions (Suspect spans) and grouping by certain span.op (http, db, browser and resource). We could definitely look at bringing in a cache one too.