Very high disk activity caused by Redis since upgrading from 22.06.0 to 22.10.0
Self-Hosted Version
22.10.0
CPU Architecture
x86_64
Docker Version
20.10.17, build 100c701
Docker Compose Version
1.29.2, build 5becea4c
Steps to Reproduce
We can't seem to reproduce the issue. It is happening on a semi regular basis, suggesting it might be to do with a cron job or something similar.
Expected Result
We have an AWS EC2 instance running the self hosted version of Sentry.
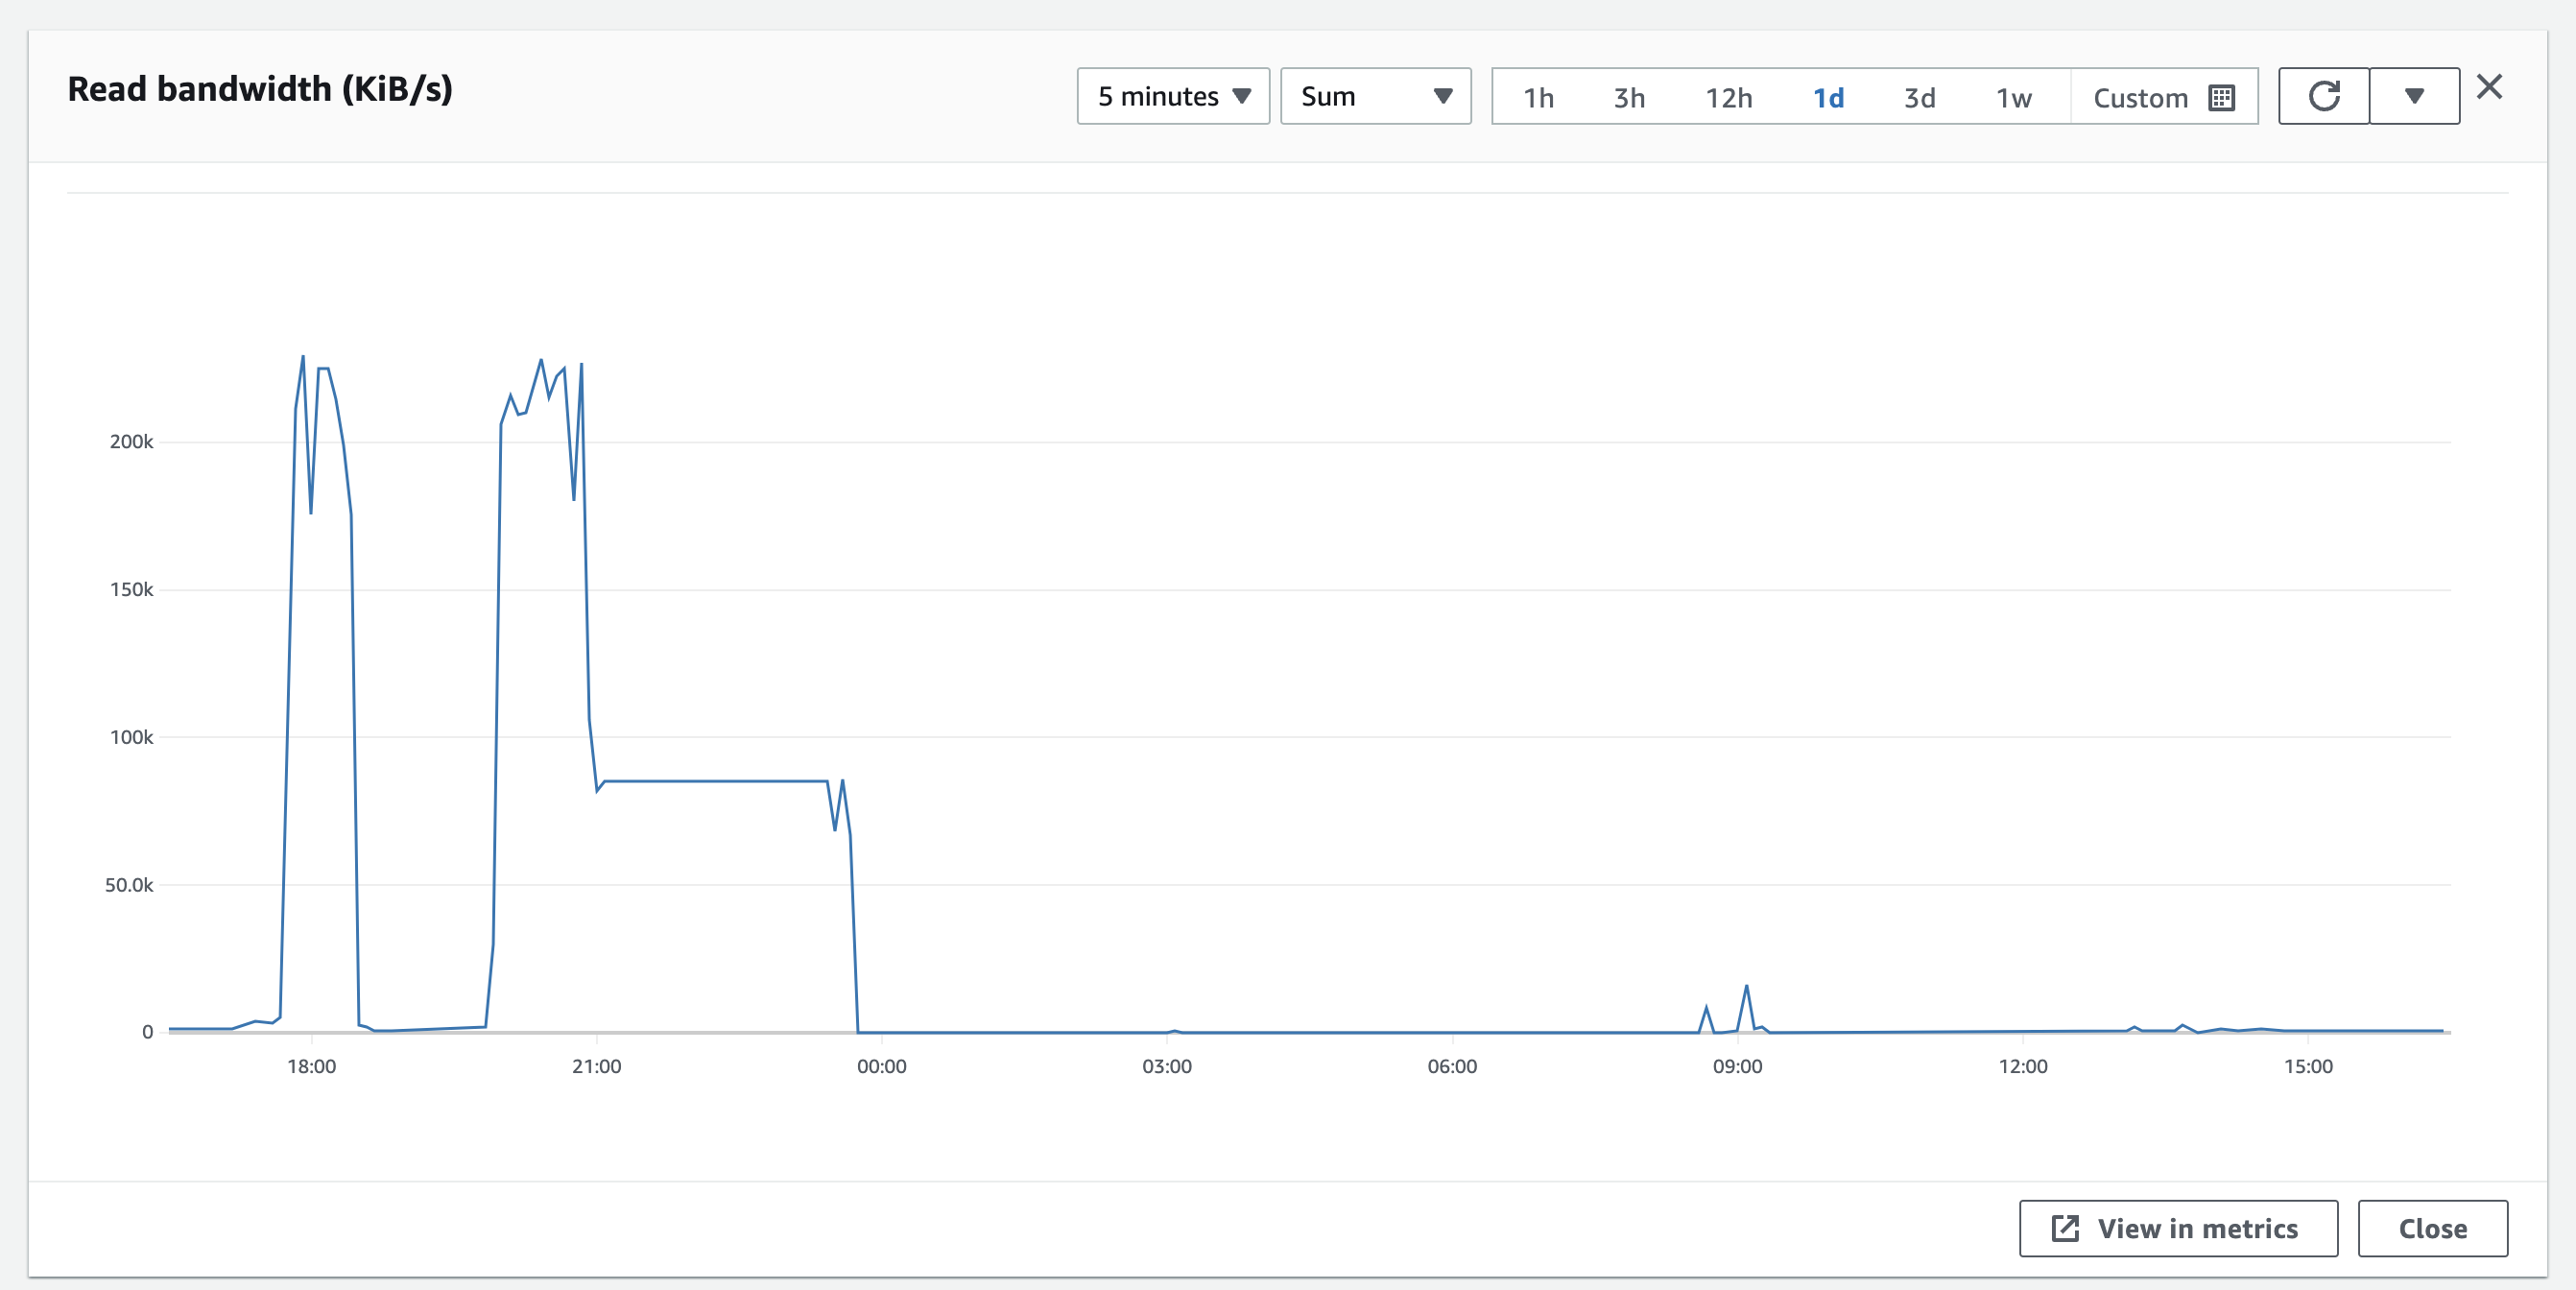
Since upgrading to 22.10 we have found that we get periodic, long, spikes of intense disk read activity. During these periods the EC2 instance becomes unusable and crashes. We must reboot the EC2 instance to recover.
This is a graph of Read Ops and Write Ops combined:

And just of Read Ops:

The instance is unreachable via SSH, although Amazon says the instance is still up. ping is failing, and our AWS ALB health check reports unhealthy too.
We have upgraded from a gp2 instance to gp3 to see if that will help, but as yet no luck.
We have fed all our logs for Sentry into Cloudwatch but have not been able to spot an obvious candidate as to the cause for this problem. We would appreciate some guidance on where to look.
So far, some patterns and thoughts we have identified:
- We use Sentry Relay, and have observed that we get a significant number of requests around the point the issue occurs. However, this appears to be a spike due to the problem, rather than causing the problem.
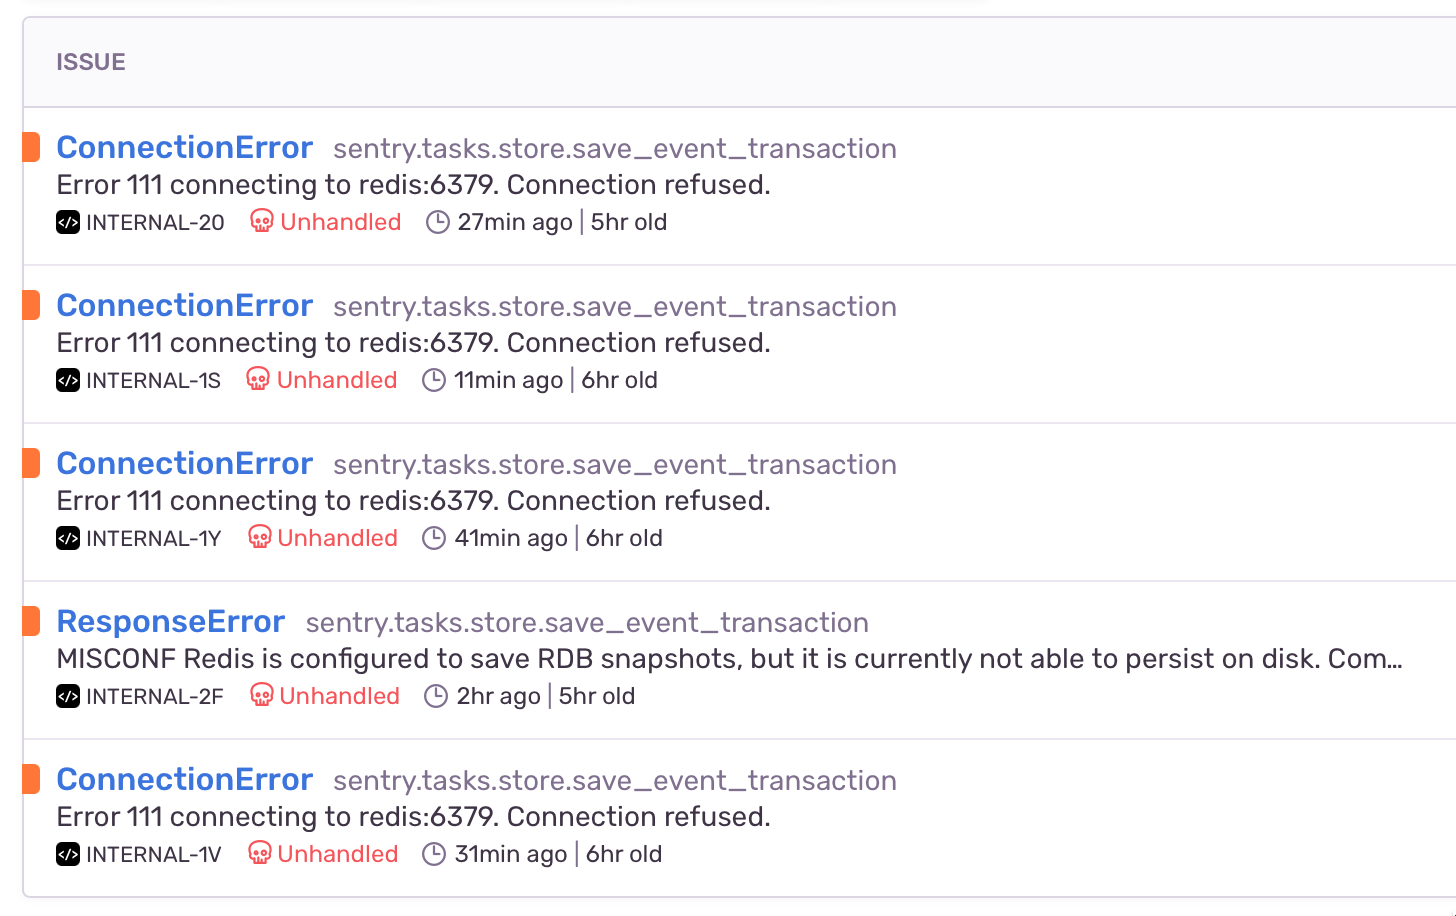
- We do see errors in the logs occasionally about redis, like:
redis.exceptions.ResponseError: MISCONF Redis is configured to save RDB snapshots, but it is currently not able to persist on disk. Commands that may modify the data set are disabled, because this instance is configured to report errors during writes if RDB snapshotting fails (stop-writes-on-bgsave-error option). Please check the Redis logs for details about the RDB error.
However, these appear to happen after the instance has restarted and do not appear to be the cause.
- We believe we're seeing errors like this one as a result of Sentry restarting/recovering, but we also believe these are red herrings
- Our disk is a 500gb EBS gp3 instance, with approximately 50% free disk space available.
Actual Result
We would expect Sentry (or dependent tools) not to hit disk as intensively, and not to crash :)
Event ID
No response
We left the disk churning overnight. The issue started around 19:58, and by 23:50 the disk read activity had returned to normal. When we woke up in the morning, the docker images were in a partially healthy state. The sentry web app was up (which is good!) - but reporting that there was an error.
docker-compose ps reported:
sentry-self-hosted_clickhouse_1                                 /entrypoint.sh                   Up (healthy)     8123/tcp, 9000/tcp, 9009/tcp
sentry-self-hosted_cron_1                                       /etc/sentry/entrypoint.sh  ...   Up               9000/tcp
sentry-self-hosted_geoipupdate_1                                /usr/bin/geoipupdate -d /s ...   Exit 1
sentry-self-hosted_ingest-consumer_1                            /etc/sentry/entrypoint.sh  ...   Exit 1
sentry-self-hosted_kafka_1                                      /etc/confluent/docker/run        Up (healthy)     9092/tcp
sentry-self-hosted_memcached_1                                  docker-entrypoint.sh memcached   Up (healthy)     11211/tcp
sentry-self-hosted_nginx_1                                      /docker-entrypoint.sh ngin ...   Up               0.0.0.0:9000->80/tcp,:::9000->80/tcp
sentry-self-hosted_post-process-forwarder-errors_1              /etc/sentry/entrypoint.sh  ...   Restarting
sentry-self-hosted_post-process-forwarder-transactions_1        /etc/sentry/entrypoint.sh  ...   Exit 1
sentry-self-hosted_postgres_1                                   /opt/sentry/postgres-entry ...   Up (healthy)     5432/tcp
sentry-self-hosted_redis_1                                      docker-entrypoint.sh redis ...   Up (unhealthy)   6379/tcp
sentry-self-hosted_relay_1                                      /bin/bash /docker-entrypoi ...   Up               3000/tcp
sentry-self-hosted_sentry-cleanup_1                             /entrypoint.sh 0 0 * * * g ...   Up               9000/tcp
sentry-self-hosted_smtp_1                                       docker-entrypoint.sh exim  ...   Up               25/tcp
sentry-self-hosted_snuba-api_1                                  ./docker_entrypoint.sh api       Up               1218/tcp
sentry-self-hosted_snuba-cleanup_1                              /entrypoint.sh */5 * * * * ...   Up               1218/tcp
sentry-self-hosted_snuba-consumer_1                             ./docker_entrypoint.sh con ...   Up               1218/tcp
sentry-self-hosted_snuba-outcomes-consumer_1                    ./docker_entrypoint.sh con ...   Exit 1
sentry-self-hosted_snuba-replacer_1                             ./docker_entrypoint.sh rep ...   Up               1218/tcp
sentry-self-hosted_snuba-sessions-consumer_1                    ./docker_entrypoint.sh con ...   Up               1218/tcp
sentry-self-hosted_snuba-subscription-consumer-events_1         ./docker_entrypoint.sh sub ...   Up               1218/tcp
sentry-self-hosted_snuba-subscription-consumer-transactions_1   ./docker_entrypoint.sh sub ...   Up               1218/tcp
sentry-self-hosted_snuba-transactions-cleanup_1                 /entrypoint.sh */5 * * * * ...   Up               1218/tcp
sentry-self-hosted_snuba-transactions-consumer_1                ./docker_entrypoint.sh con ...   Exit 1
sentry-self-hosted_subscription-consumer-events_1               /etc/sentry/entrypoint.sh  ...   Restarting
sentry-self-hosted_subscription-consumer-transactions_1         /etc/sentry/entrypoint.sh  ...   Exit 1
sentry-self-hosted_symbolicator-cleanup_1                       /entrypoint.sh 55 23 * * * ...   Up               3021/tcp
sentry-self-hosted_symbolicator_1                               /bin/bash /docker-entrypoi ...   Up               3021/tcp
sentry-self-hosted_web_1                                        /etc/sentry/entrypoint.sh  ...   Up (healthy)     9000/tcp
sentry-self-hosted_worker_1                                     /etc/sentry/entrypoint.sh  ...   Exit 1
sentry-self-hosted_zookeeper_1                                  /etc/confluent/docker/run        Up (healthy)     2181/tcp, 2888/tcp, 3888/tcp
Running docker-compose up sorted us out.
The total disk ops activity looked like this - so something was really aggressively reading from disk for a long period, and then finished. The tiny blip around 8am is when we rebooted Sentry.
We can't see anything obvious in our logs - and during the period no logs were written to AWS unfortunately.
We're now monitoring iotop to see if there's any clues in there.
We see Clickhouse is the primary reader, and Redis is the primary writer (but redis only writes every now and again - in big chunks of about 1G). Clickhouse doesn't look to be actually doing much - SHOW PROCESSLIST doesn't show anything obvious, and the table sizes don't look absurd:
┌─table─────────────────┬─size───────┬─────rows─┬─days─┬─avgDaySize─┐
│ outcomes_raw_local    │ 333.23 MiB │ 19437398 │    0 │ inf YiB    │
│ transactions_local    │ 1.74 GiB   │ 12518960 │    0 │ inf YiB    │
│ metric_log            │ 1.18 GiB   │ 11858191 │  138 │ 8.73 MiB   │
│ errors_local          │ 121.11 MiB │   398028 │    0 │ inf YiB    │
│ trace_log             │ 13.83 MiB  │   236079 │  138 │ 102.64 KiB │
│ sessions_raw_local    │ 260.48 KiB │    10931 │    0 │ inf YiB    │
│ outcomes_hourly_local │ 113.43 KiB │     7938 │    0 │ inf YiB    │
│ sessions_hourly_local │ 68.59 KiB  │      638 │    0 │ inf YiB    │
│ migrations_local      │ 2.30 KiB   │       97 │    0 │ inf YiB    │
└───────────────────────┴────────────┴──────────┴──────┴────────────┘
Postgres is definitely the largest use of disk, so we will attempt to look at that next.
I'm wondering if this has something to do with https://github.com/getsentry/self-hosted/issues/1787
We've been looking much more into this today.
While last night everything was fine, this morning we'd had the same problem around 3am - disk ops spiked, the service crashed, everything fell over.
We found that - and we don't know if these are correlations or causations - that:
- The
workerservice seems to be the source of our woes - Something within there is causing problems.
- We originally suspected the cleanup and cron jobs too - but cleanup we eliminated quite quickly.
croncould still be a contender, but it looks likeworkeris the more likely one. - We identified that we didn't have logging on for the
workeror thecronbox - I think when we turned on logging we only had it for things we thought might affect the web, so we didn't include those two. We've now got logs for them both.
We think there might also be a correlation with mail being the problem.
We're using AWS SES to send emails over SMTP. We noticed that there does appear to be a bit of a correlation between when these crashes occur and how many emails we're sending. We're disabling mail by changing the config to console and seeing if that makes a difference.
It does seem a bit farfetched, but we're going to try it out.
For reference, here's our docker-compose.override.yml:
x-logging-config: &logging_config
  environment:
    SENTRY_LOG_LEVEL: DEBUG
  logging:
    driver: "awslogs"
    options:
      awslogs-region: "eu-west-1"
      awslogs-group: "sentry"
      tag: "{{.Name}}/{{.ID}}"
services:
  clickhouse:
    <<: *logging_config
  kafka:
    <<: *logging_config
  redis:
    <<: *logging_config
  postgres:
    <<: *logging_config
  zookeeper:
    <<: *logging_config
  snuba-api:
    <<: *logging_config
  snuba-outcomes-consumer:
    <<: *logging_config
  snuba-sessions-consumer:
    <<: *logging_config
  snuba-transactions-consumer:
    <<: *logging_config
  snuba-replacer:
    <<: *logging_config
  snuba-cleanup:
    <<: *logging_config
  snuba-transactions-cleanup:
    <<: *logging_config
  web:
    <<: *logging_config
    extra_hosts:
      - host.docker.internal:host-gateway
  cron:
    <<: *logging_config
    extra_hosts:
      - host.docker.internal:host-gateway
  worker:
    <<: *logging_config
    extra_hosts:
      - host.docker.internal:host-gateway
  ingest-consumer:
    <<: *logging_config
    extra_hosts:
      - host.docker.internal:host-gateway
  post-process-forwarder-transactions:
    <<: *logging_config
    extra_hosts:
      - host.docker.internal:host-gateway
  post-process-forwarder-errors:
    <<: *logging_config
    extra_hosts:
      - host.docker.internal:host-gateway
  subscription-consumer-events:
    <<: *logging_config
    extra_hosts:
      - host.docker.internal:host-gateway
  subscription-consumer-transactions:
    <<: *logging_config
    extra_hosts:
      - host.docker.internal:host-gateway
  sentry-cleanup:
    <<: *logging_config
    extra_hosts:
      - host.docker.internal:host-gateway
  nginx:
    <<: *logging_config
  relay:
    <<: *logging_config
It's crashed again... which implies our mail theory isn't right. Although we have noticed it seems to be staying up and recovering rather than completely crashing.
We've also noticed that the oom-killer is getting called and seems to be a contributor to the crashes - which would make sense. And I've got a graph of memory usage that implies that it's something about memory:
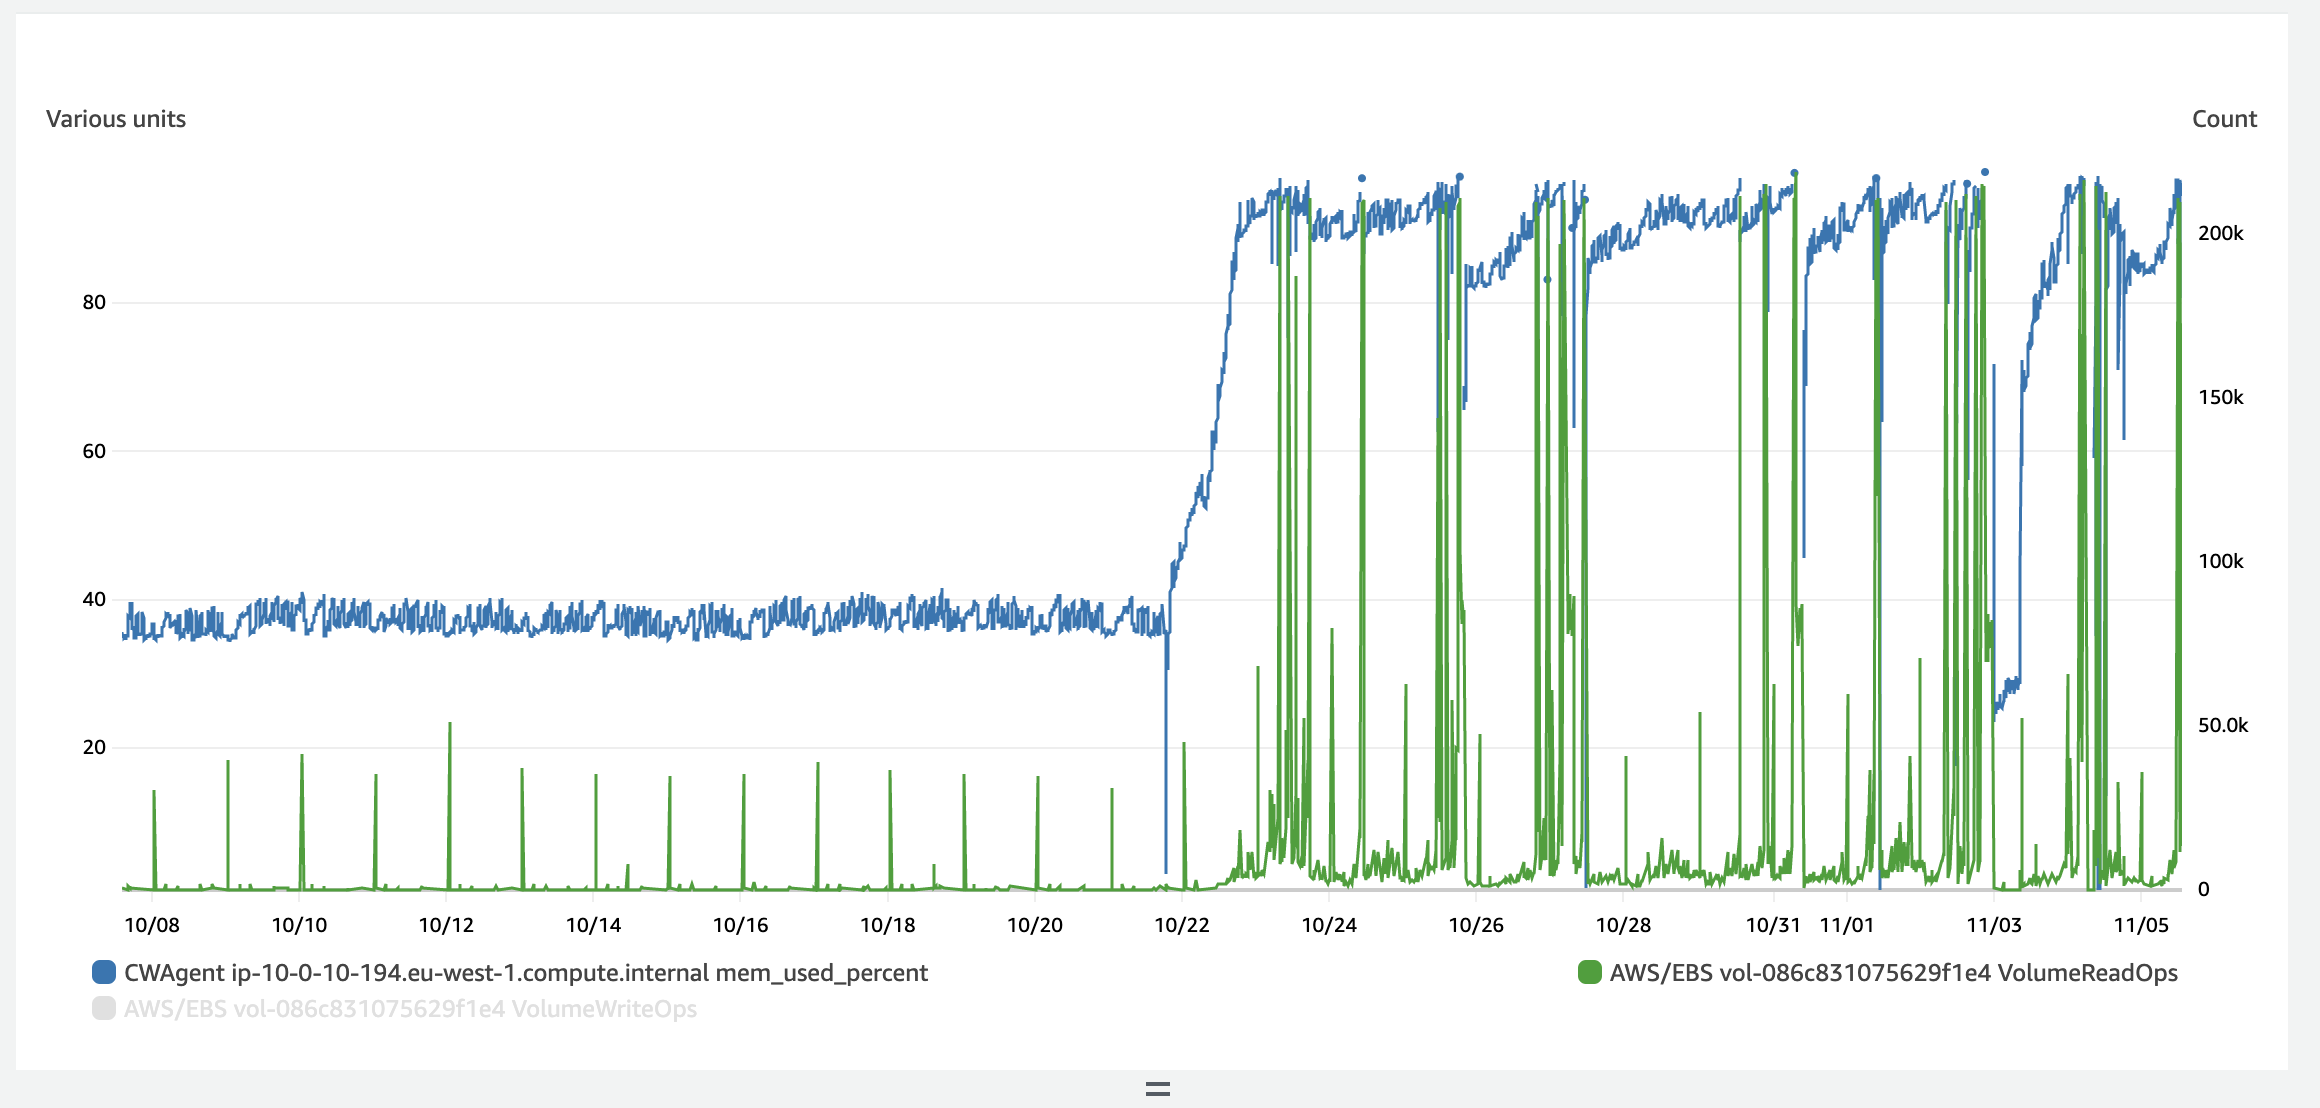
So maybe the redis theory is right, given that is the highest user of memory according to docker stats:
1cc5a59ce662   sentry-self-hosted_nginx_1                                      0.09%     4.355MiB / 15.44GiB   0.03%     1.19GB / 1.22GB   25.1GB / 0B       5
34904d3fed80   sentry-self-hosted_relay_1                                      0.76%     635.1MiB / 15.44GiB   4.02%     1.13GB / 6.25GB   91.6GB / 0B       46
956605a56494   sentry-self-hosted_post-process-forwarder-transactions_1        0.31%     117.3MiB / 15.44GiB   0.74%     2.97MB / 2.3MB    2.02GB / 0B       11
59408f368f5f   sentry-self-hosted_subscription-consumer-transactions_1         0.22%     116.1MiB / 15.44GiB   0.73%     2.85MB / 1.99MB   2.24GB / 0B       6
9f009fecf548   sentry-self-hosted_sentry-cleanup_1                             0.00%     600KiB / 15.44GiB     0.00%     989kB / 465kB     472MB / 30.7kB    1
1f597341a95b   sentry-self-hosted_post-process-forwarder-errors_1              0.42%     136.2MiB / 15.44GiB   0.86%     49.1MB / 1.72MB   183MB / 0B        13
13a1e52891ea   sentry-self-hosted_cron_1                                       0.00%     157.9MiB / 15.44GiB   1.00%     6.55MB / 57.4MB   3.76GB / 6.83MB   4
d9a9476857b5   sentry-self-hosted_web_1                                        0.01%     593.6MiB / 15.44GiB   3.75%     42MB / 84.9MB     19.1GB / 0B       34
83c61cdfc5e2   sentry-self-hosted_ingest-consumer_1                            0.26%     126.6MiB / 15.44GiB   0.80%     241MB / 255MB     35.4MB / 0B       7
457602f1ba25   sentry-self-hosted_subscription-consumer-events_1               0.24%     116.4MiB / 15.44GiB   0.74%     1.79MB / 1.22MB   126MB / 0B        6
531e85eb600f   sentry-self-hosted_worker_1                                     0.97%     645.9MiB / 15.44GiB   4.08%     436MB / 1.08GB    1.56GB / 0B       41
598795b34e5c   sentry-self-hosted_snuba-transactions-consumer_1                0.55%     85.22MiB / 15.44GiB   0.54%     347MB / 15.3MB    26.8MB / 0B       10
ee64b3406876   sentry-self-hosted_snuba-subscription-consumer-events_1         0.34%     77.25MiB / 15.44GiB   0.49%     2.24MB / 1.32MB   129MB / 0B        9
c06eb9e4b632   sentry-self-hosted_snuba-transactions-cleanup_1                 0.00%     480KiB / 15.44GiB     0.00%     680kB / 391kB     9.69GB / 32.3kB   1
c0a813c3c68e   sentry-self-hosted_snuba-outcomes-consumer_1                    0.53%     77.31MiB / 15.44GiB   0.49%     6.06MB / 4.34MB   27.7MB / 0B       10
19182d2461bc   sentry-self-hosted_snuba-sessions-consumer_1                    0.37%     78.49MiB / 15.44GiB   0.50%     56.8MB / 39.1MB   8.39GB / 0B       10
34cf34263bc8   sentry-self-hosted_snuba-api_1                                  0.04%     90.58MiB / 15.44GiB   0.57%     4.39MB / 12.9MB   12.6GB / 0B       6
0c4b90059d72   sentry-self-hosted_snuba-cleanup_1                              0.00%     608KiB / 15.44GiB     0.00%     680kB / 389kB     9.73GB / 30.2kB   1
1f9e6759a0e6   sentry-self-hosted_snuba-subscription-consumer-transactions_1   0.35%     76.2MiB / 15.44GiB    0.48%     58.6MB / 41.4MB   9.68GB / 0B       9
a6c3ffd5aeb4   sentry-self-hosted_snuba-replacer_1                             0.16%     76.8MiB / 15.44GiB    0.49%     2.82MB / 1.92MB   1.42GB / 0B       5
63415d42fa5a   sentry-self-hosted_snuba-consumer_1                             0.30%     79.82MiB / 15.44GiB   0.50%     8.03MB / 2.8MB    192MB / 0B        10
3a31087c771b   sentry-self-hosted_kafka_1                                      2.34%     811.3MiB / 15.44GiB   5.13%     13.7GB / 14.5GB   61.3GB / 290MB    75
e5dab8fbf5be   sentry-self-hosted_smtp_1                                       0.00%     1.102MiB / 15.44GiB   0.01%     327kB / 183B      1.24GB / 0B       2
e6471bb4d9b7   sentry-self-hosted_redis_1                                      0.26%     9.683GiB / 15.44GiB   62.69%    579MB / 254MB     2.44GB / 28.4GB   5
bdd519bc1ef0   sentry-self-hosted_symbolicator_1                               0.00%     6.738MiB / 15.44GiB   0.04%     327kB / 0B        7.7GB / 0B        14
02a7677bc98d   sentry-self-hosted_postgres_1                                   0.04%     174.6MiB / 15.44GiB   1.10%     2.48GB / 213MB    50.3GB / 11.5GB   12
3611090a51f6   sentry-self-hosted_clickhouse_1                                 5.59%     444.6MiB / 15.44GiB   2.81%     332MB / 55.1MB    129GB / 9.57MB    75
56f235ca22fa   sentry-self-hosted_zookeeper_1                                  0.12%     95.69MiB / 15.44GiB   0.61%     2.03MB / 1.13MB   21.7GB / 240kB    48
ea1ab29f6086   sentry-self-hosted_memcached_1                                  0.11%     42.38MiB / 15.44GiB   0.27%     242MB / 794MB     10.6GB / 0B       10
bf5c6f7e0026   sentry-self-hosted_symbolicator-cleanup_1                       0.00%     492KiB / 15.44GiB     0.00%     327kB / 0B        752MB / 31.7kB    1
I'm not sure what normal operation would be though - so I'm unsure if 9gig for redis is a lot or not.
I've installed this monitoring script for redis and this one for docker to see if there's any clues in there.
P.s. it might be useful to know: We're using a t3.xlarge AWS instance. That's 4 cores + 16gb of memory.
Still continuing to crash. Not seeing anything especially obvious in our logs. oom-killer does seem like the thing responsible for killing the service.
We're trying a new redis config:
In docker-compose.override.yml:
  redis:
    <<: *logging_config
    command: redis-server /usr/local/etc/redis/redis.conf
    volumes:
      - ./redis.conf:/usr/local/etc/redis/redis.conf
    ports:
      - "6379:6379"
And redis.conf:
# Redis configuration file example.

maxmemory 4294967296 # 8589934592


maxmemory-policy volatile-ttl
Since then, memory usage has been much lower (as expected), but it's too early to tell yet whether this has resolved the problem.
I've also used:
redis-cli --scan | cut -c-1 | sort | uniq -c to try and identify how many different sorts of keys there are... see if that gives a clue:
      4 _
  69416 c
      1 o
      1 r
  16579 t
I'm not familiar with redis much though, so I don't know if this is useful or not.
Since we've turned on the memory limit, we see the graph of evictions has gone up significantly (from basically 0 to loads)
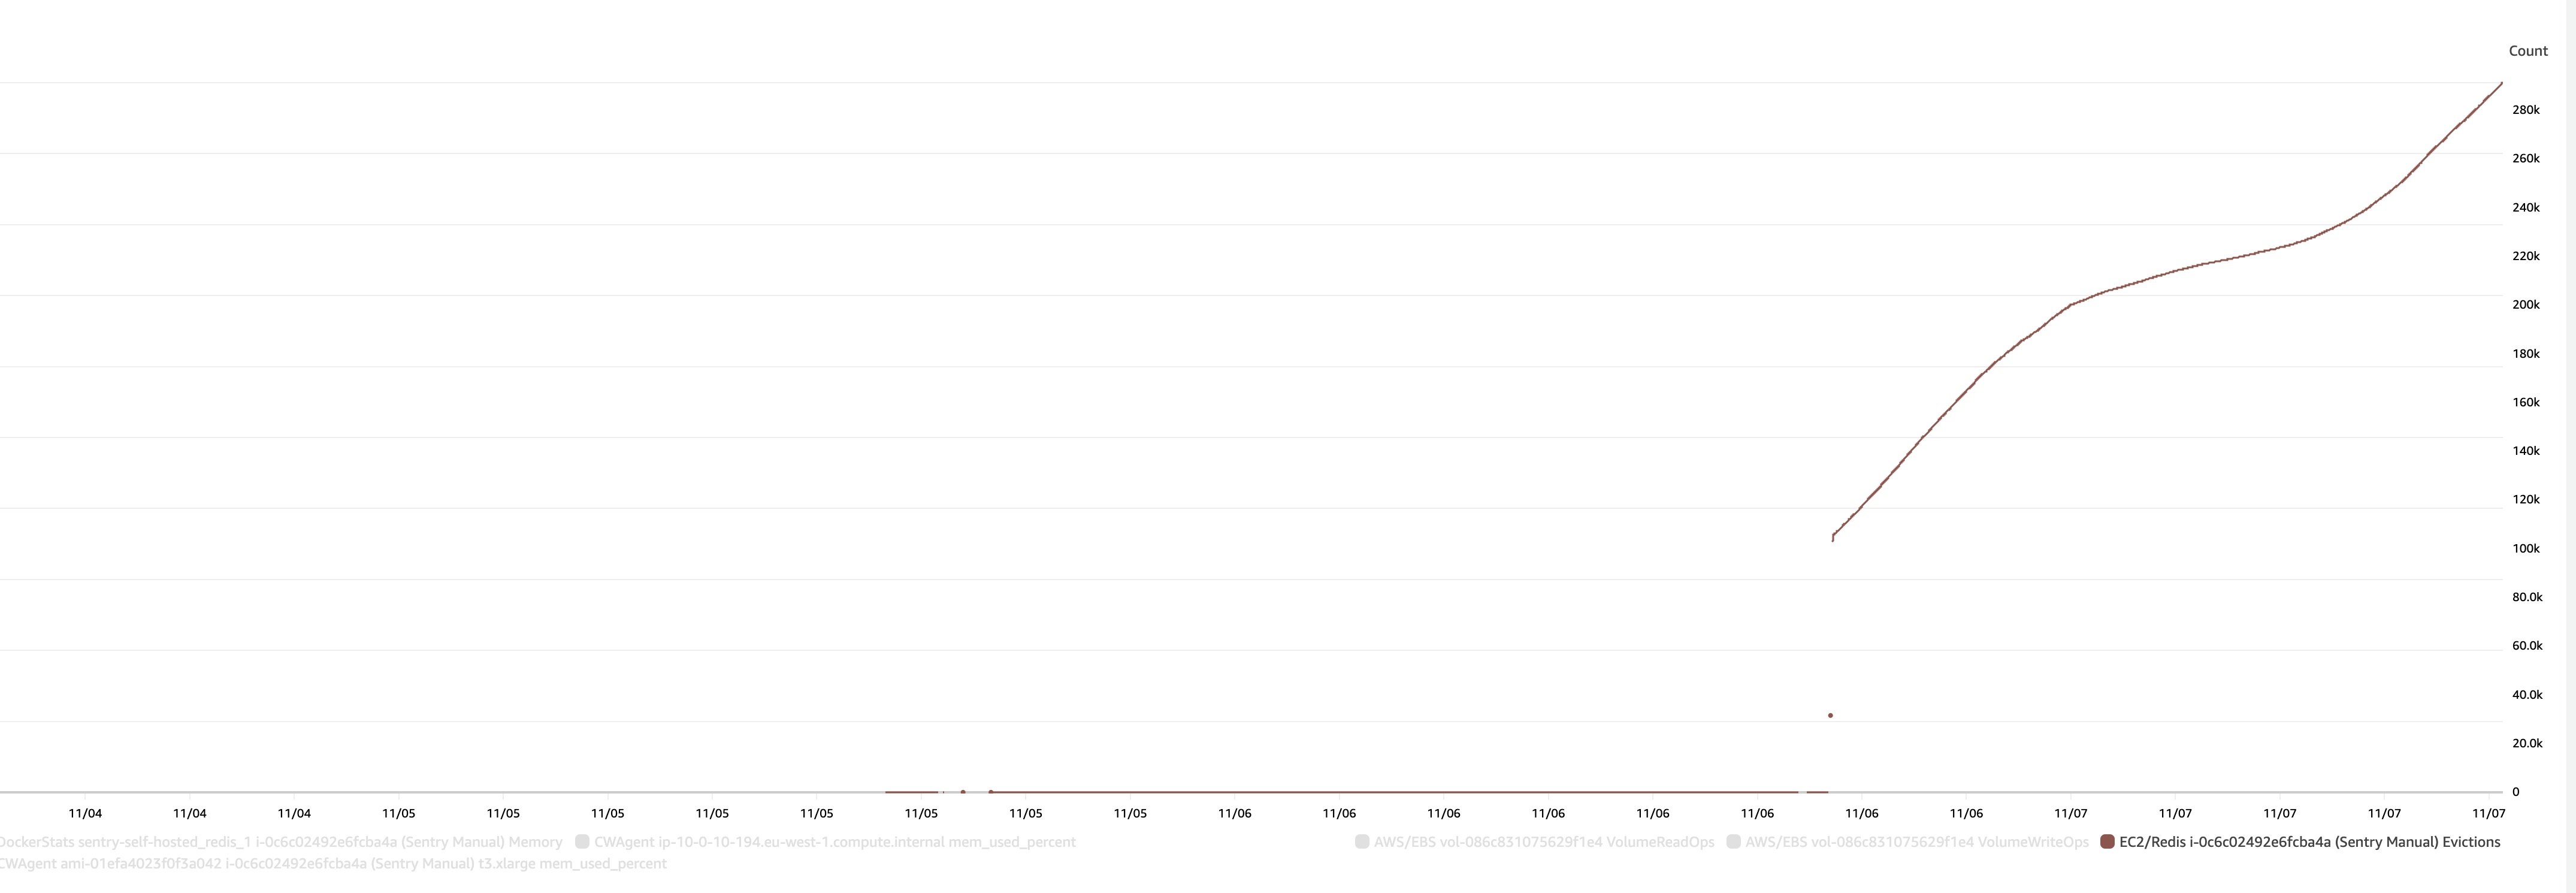
And I think this one illustrates what's going on - memory was increasing and increasing and nothing was ever being evicted, leading to eventual crashes.
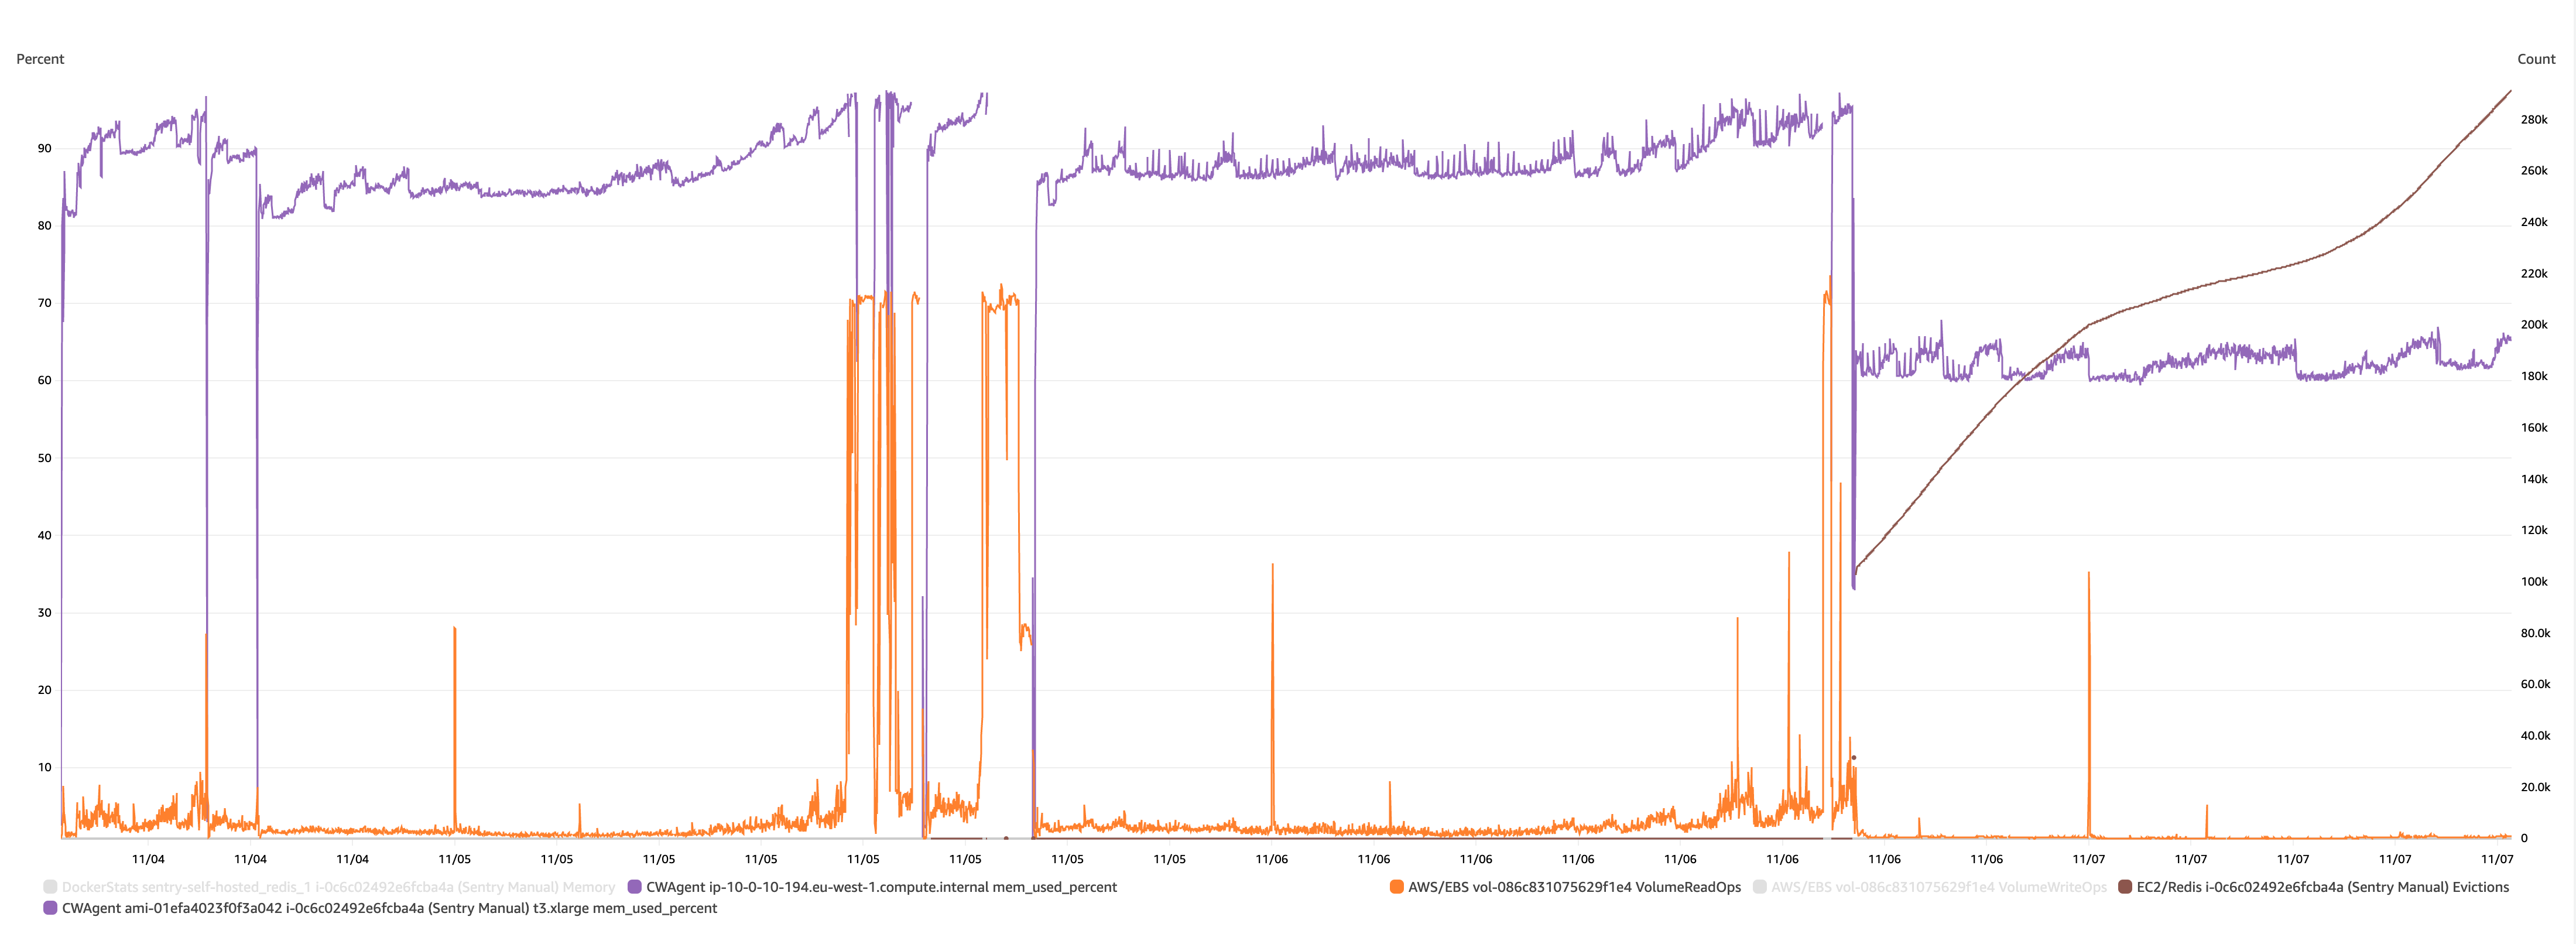
My current working theory is then:
- Something was previously causing Redis to increase and increase
- When redis got more and more full, it started hitting swap I guess (leading to an increase in disk activity?)
- Which eventually triggered the oom-killer to kill something, which may or may not break the Sentry system.
By limiting memory we're increasing the number of evictions, and freeing up memory.
We haven't seen a crash since that was applied, but it's still early days.
Which again points to https://github.com/getsentry/self-hosted/issues/1787 being the problem.
Really great debugging, thanks for digging into this. It does seem that Redis either isn't able to write to disk or otherwise dispatch incoming data, so it is keeping everything in memory until you fill your memory... then you swap out, trash the disk, things crash, an all-around bad time.
Thinking about how to debug redis... I guess you could strace? Might be too noisy. Also maybe consider checking to see when services crash/experience errors. It could be the worker image crashes for some reason then redis can't do anything...
I confirm since making this change, we have had no crashes. Limiting the amount of memory has solved the problem.
I don't think we're having any trouble writing to disk - we're seeing successful writes continually in the logs. And I haven't noticed anything broken in Sentry - everything seems ok.
Here's what redis' logs are for the last 10 minutes for instance:
-------------------------------------------------------------------------------------------------
|   timestamp   |                                    message                                    |
|---------------|-------------------------------------------------------------------------------|
| 1667936128087 | 1:M 08 Nov 2022 19:35:28.086 * 10000 changes in 60 seconds. Saving...         |
| 1667936128207 | 1:M 08 Nov 2022 19:35:28.207 * Background saving started by pid 25942         |
| 1667936143415 | 25942:C 08 Nov 2022 19:35:43.414 * DB saved on disk                           |
| 1667936143557 | 25942:C 08 Nov 2022 19:35:43.557 * RDB: 11 MB of memory used by copy-on-write |
| 1667936143741 | 1:M 08 Nov 2022 19:35:43.741 * Background saving terminated with success      |
| 1667936204086 | 1:M 08 Nov 2022 19:36:44.085 * 10000 changes in 60 seconds. Saving...         |
| 1667936204175 | 1:M 08 Nov 2022 19:36:44.175 * Background saving started by pid 25955         |
| 1667936218537 | 25955:C 08 Nov 2022 19:36:58.537 * DB saved on disk                           |
| 1667936218684 | 25955:C 08 Nov 2022 19:36:58.684 * RDB: 9 MB of memory used by copy-on-write  |
| 1667936218870 | 1:M 08 Nov 2022 19:36:58.870 * Background saving terminated with success      |
| 1667936279058 | 1:M 08 Nov 2022 19:37:59.058 * 10000 changes in 60 seconds. Saving...         |
| 1667936279235 | 1:M 08 Nov 2022 19:37:59.235 * Background saving started by pid 25974         |
| 1667936295144 | 25974:C 08 Nov 2022 19:38:15.144 * DB saved on disk                           |
| 1667936295307 | 25974:C 08 Nov 2022 19:38:15.307 * RDB: 11 MB of memory used by copy-on-write |
| 1667936295603 | 1:M 08 Nov 2022 19:38:15.603 * Background saving terminated with success      |
| 1667936356062 | 1:M 08 Nov 2022 19:39:16.062 * 10000 changes in 60 seconds. Saving...         |
| 1667936356149 | 1:M 08 Nov 2022 19:39:16.149 * Background saving started by pid 25989         |
| 1667936370636 | 25989:C 08 Nov 2022 19:39:30.636 * DB saved on disk                           |
| 1667936370821 | 25989:C 08 Nov 2022 19:39:30.821 * RDB: 12 MB of memory used by copy-on-write |
| 1667936371064 | 1:M 08 Nov 2022 19:39:31.064 * Background saving terminated with success      |
| 1667936432060 | 1:M 08 Nov 2022 19:40:32.059 * 10000 changes in 60 seconds. Saving...         |
| 1667936432305 | 1:M 08 Nov 2022 19:40:32.305 * Background saving started by pid 26008         |
| 1667936447504 | 26008:C 08 Nov 2022 19:40:47.504 * DB saved on disk                           |
| 1667936447649 | 26008:C 08 Nov 2022 19:40:47.649 * RDB: 10 MB of memory used by copy-on-write |
| 1667936447860 | 1:M 08 Nov 2022 19:40:47.860 * Background saving terminated with success      |
| 1667936508000 | 1:M 08 Nov 2022 19:41:48.000 * 10000 changes in 60 seconds. Saving...         |
| 1667936508142 | 1:M 08 Nov 2022 19:41:48.142 * Background saving started by pid 26021         |
| 1667936522108 | 26021:C 08 Nov 2022 19:42:02.108 * DB saved on disk                           |
| 1667936522311 | 26021:C 08 Nov 2022 19:42:02.311 * RDB: 12 MB of memory used by copy-on-write |
| 1667936522517 | 1:M 08 Nov 2022 19:42:02.517 * Background saving terminated with success      |
| 1667936583049 | 1:M 08 Nov 2022 19:43:03.049 * 10000 changes in 60 seconds. Saving...         |
| 1667936583163 | 1:M 08 Nov 2022 19:43:03.163 * Background saving started by pid 26040         |
| 1667936598269 | 26040:C 08 Nov 2022 19:43:18.269 * DB saved on disk                           |
| 1667936598413 | 26040:C 08 Nov 2022 19:43:18.413 * RDB: 12 MB of memory used by copy-on-write |
| 1667936598689 | 1:M 08 Nov 2022 19:43:18.689 * Background saving terminated with success      |
| 1667936659022 | 1:M 08 Nov 2022 19:44:19.022 * 10000 changes in 60 seconds. Saving...         |
| 1667936659171 | 1:M 08 Nov 2022 19:44:19.171 * Background saving started by pid 26053         |
-------------------------------------------------------------------------------------------------
@ethanhs - does anything stand out in these logs which suggest there are problems writing to disk? Anything you'd expect to see which isn't there?
Now we've got the eviction happening, it feels more and more like the keys growing rather than there being a problem with redis specifically.
@hubertdeng123 is there anything you can think would help with debugging? The urgency is off for me, but while it's all fresh in my mind I'd be happy to try more things.
Yeah I was originally thinking it was due to the
: MISCONF Redis is configured to save RDB snapshots, but it is currently not able to persist on disk
error you mentioned above but I'm pretty sure that's a red herring. I don't see anything out of the ordinary in those logs.
Do we have people here who actually know the data flow of Sentry. I've tried to figure it out but can't find which component should read the entries from redis and delete afterwards. To see what changed between 22.09 and 22.10 in this component. As the number of keys in redis didn't grow in 22.09. Just after upgrading to 22.10 the problem started. Can't be redis as we have it configured outside of the Sentry compose file and redis didn't change at all. We also can't use eviction policy as we have important keys in the same redis cluster.
I am having the same issue on my instance, redis memory grew until it filled all the available memory, and some consumers + clickhouse were taking a lot of CPU usage.
I had those errors in my Sentry Internal project:
Things are getting better after configuring maxmemory and maxmemory-policy volatile-ttl as hinted above, I assume redis started to delete old keys, its memory usage went down and the consumers are now able to correctly process the jobs.
We updated to 22.10.0 a few days ago and this never happened before, so it is most probably related to this release.
This issue has gone three weeks without activity. In another week, I will close it.
But! If you comment or otherwise update it, I will reset the clock, and if you label it Status: Backlog or Status: In Progress, I will leave it alone ... forever!
"A weed is but an unloved flower." ― Ella Wheeler Wilcox 🥀
@edhgoose I am a bit stuck on configuring Amazon SES with my Sentry instance.
I have made the related changes on - this link
Just elaborating to be clear:
-
Created an
.env.customfile with an entry forSENTRY_MAIL_HOST=email-smtp.ap-south-1.amazonaws.comand I use this env file to start my docker eco system. -
In the
sentry/config.ymlI have these entries
mail.backend: 'smtp'
mail.host: 'email-smtp.ap-south-1.amazonaws.com'
mail.port: 587
mail.username: 'myuser'
mail.password: 'mypwd'
mail.use-tls: false
mail.use-ssl: false
mail.from: '[email protected]'
- In the
sentry/sentry.conf.pyfile, I have commented the sentry options.
Even with all this, I still get Connection Refused in the worker docker's logs.
I'll appreciate any help or pointers on this one, please?
@swateek I don't know how to help - I think you want to raise a new issue. Your issue isn't related to this one about disk activity.
We're seeing the same issue.
@edhgoose do you think we should update the issue title given that the underlying cause seems to be Redis and not the disk writes?
@edhgoose do you think we should update the issue title given that the underlying cause seems to be Redis and not the disk writes?
Sure. I've gone for a merge of the two.
Based on my research looks like sentry start "put" events data to redis with expiration 24 hours, which lead this events very quickly fill memory in redis (because one event can have 100-200kb of stringify json) - https://github.com/getsentry/self-hosted/issues/1787#issuecomment-1454899562
Some process (maybe workers) forget to do DEL/UNLINK this data after GET this data from redis and process it
I would also like to know how to set the memory eviction policy in redis - and to be sure it doesn't cause issues to Sentry.
It looks like https://github.com/getsentry/self-hosted/pull/3427 resolves this issue. It might still be a good idea to specify a maxmemory in the redis.conf.
https://github.com/getsentry/self-hosted/blob/b439c67e17120c9fdd20aec5250a6357f78bd6c0/redis.conf#L3-L6