#8588 - Chart switcher for Chart widget
Description
This PR adds new feature to dashboard chart widgets where the user can configure multi charts and configure them in a widget
Please check if the PR fulfills these requirements
- [x] The commit message follows our guidelines: https://github.com/geosolutions-it/MapStore2/blob/master/CONTRIBUTING.md
- [x] Tests for the changes have been added (for bug fixes / features)
- [x] Docs have been added / updated (for bug fixes / features)
What kind of change does this PR introduce? (check one with "x", remove the others)
- [x] Feature
Issue
What is the current behavior? #8588
What is the new behavior? User can configure multi charts by selecting multiple layers and configure charts options individually
Breaking change
Does this PR introduce a breaking change? (check one with "x", remove the other)
- [ ] Yes, and I documented them in migration notes
- [x] No
Other useful information
@allyoucanmap Thanks for the review. Except for the change in UI proposal, I have pushed a missing commit that should fix rest of the issues mentioned above. Kindly review at your convenience.
@dsuren1 @allyoucanmap
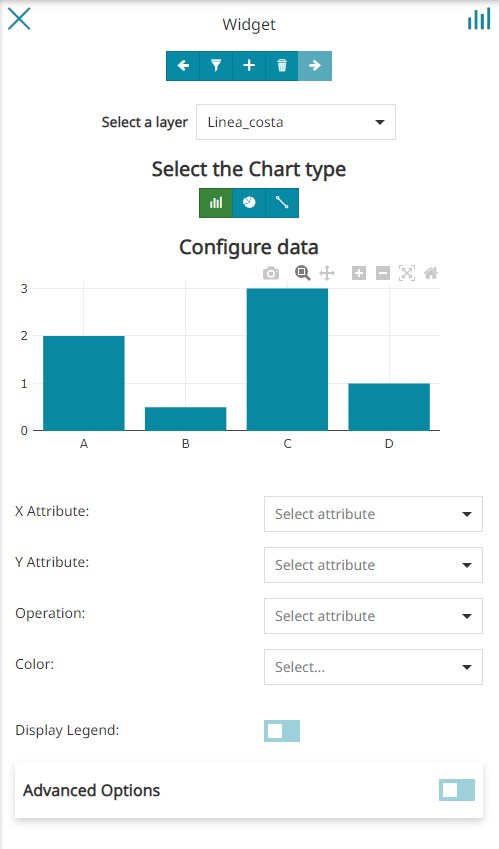
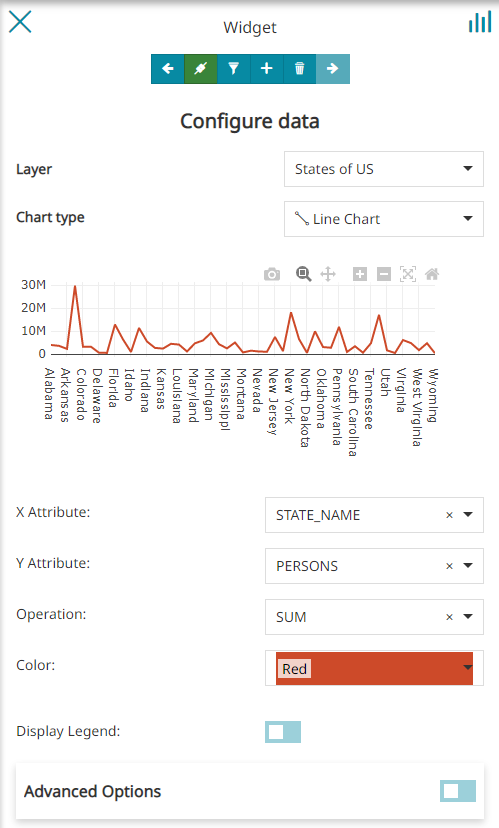
UI change proposal (left current PR, right proposal cc @tdipisa )
The UI seems more clean in the one proposed by @allyoucanmap, I like it. @dsuren1 what is the effort to use it instead of the current one you provided?
UI change proposal (left current PR, right proposal cc @tdipisa )
The UI seems more clean in the one proposed by @allyoucanmap, I like it. @dsuren1 what is the effort to use it instead of the current one you provided?
@tdipisa 1 point including implementation, code and style cleanup, unit tests etc
UI change proposal (left current PR, right proposal cc @tdipisa )
The UI seems more clean in the one proposed by @allyoucanmap, I like it. @dsuren1 what is the effort to use it instead of the current one you provided?
@tdipisa 1 point including implementation, code and style cleanup, unit tests etc
@dsuren1 please proceed.
@tdipisa
Updated chart wizard layout
@allyoucanmap Kindly review at your convenience.
- [ ] I did not spot where this is happening in the code but it seems there is an issue after adding a new layer to chart that it is still using the attributes of previous layer (SUB_REGION attribe in the error is a States layer property) https://user-images.githubusercontent.com/19175505/196222661-31a62780-1bfe-484d-bc53-7a5634ad2661.mp4
@allyoucanmap
In this example, the widget used is connected to a table and when adding a new layer to the chart widget, it uses the filter applied on the table (sync) and results in the following error. Adding a layer with similar attributes should work ex: USA Population. This behavior is observed when connected widget is a table.
Alternate solution after dicussion with @allyoucanmap Alternatively, we can avoid this with one of these option,
- Don't apply the filter to the layer if name/attrib doesn't matches with the table filter and add a warning in the editor explaining the cause ex:
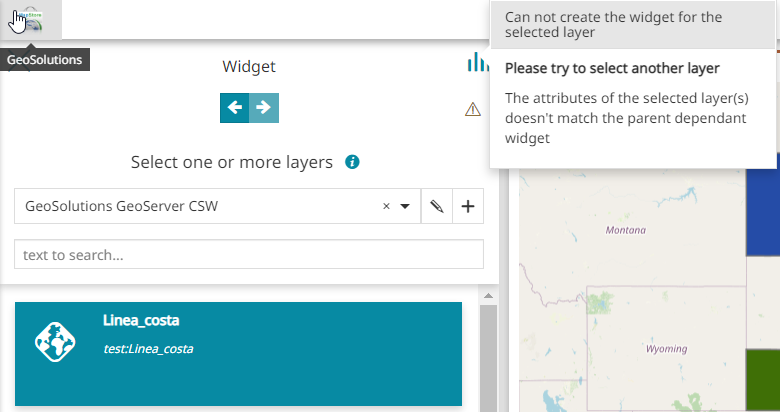
The attributes in the filter doesn't match the one with the current layer - When a chart widget is connected to a table, also the layers in a multi chart widget cannot be duplicated, so we prevent user from adding a new layer, as filter can be applied to only matching layer and attributes in the connected table widget
- One could be to prevent to add layer with explanation if a filter is applied (least favorable)
@tdipisa Kindly let us know the option that you think is best suited for the user
@dsuren1
@tdipisa Kindly let us know the option that you think is best suited for the user
As discussed in the call the good solution should be that one:
One could be to prevent to add layer with explanation if a filter is applied (least favorable)
We should effectively prevent the user to reach the chart config section if the layer doesn't match the schema in that particular case (widget connected to a parent table).
@dsuren1 please let me know how much effort this check requires.
It requires a little more than 1 pt (approx. 2 pts) including cleanup, unit tests etc
@tdipisa @allyoucanmap
Following error will be displayed upon selecting a layer with unmatched attributes with dependant table widget
@dsuren1 nice, it looks good. Thank you. @allyoucanmap you can review I think at your convenience.
@ElenaGallo please test on dev and let us know if we can backport it, thanks
Hi @dsuren1, some notes after my testing (you can used this dashboard):
- [ ] Editing Pie and Bar charts with custom color allows to switch charts type but once changed to Line Chart the custom color on Pie and Bar charts are no longer enable
https://user-images.githubusercontent.com/56537133/197206968-26dc302e-692f-4c9d-a342-1b441cfbe4f5.mov
- [ ] After inserting the filter to one of the two configured charts, opening the filter again, it is no longer visible
https://user-images.githubusercontent.com/56537133/197207317-ca615a22-142d-47fc-92bc-66394b226905.mov
- [ ] After inserting the filter to one of the two configured charts, the second chart is no longer visible in the preview
https://user-images.githubusercontent.com/56537133/197207451-8e378e99-c2c9-400e-8dc1-e40cd1675658.mov
- [ ] Once a new Pie Chart has been added to the list, the legend is visible even if the Display Legend option is not enable
https://user-images.githubusercontent.com/56537133/197207687-84373bf9-202d-4703-bde5-1fcabc6883dc.mov
- [ ] @tdipisa In the Configure Widget Info, wouldn't it be better not to have the Layers list if the title and description can only be one for all the charts?
https://user-images.githubusercontent.com/56537133/197207826-44d4cce8-7b09-494a-9fdb-b2199c6e9ea8.mov
- [ ] If I add a new widget to a map, it is not visible on the map.
https://user-images.githubusercontent.com/56537133/197207944-f9519c69-c80d-4ed8-99c4-55600906924e.mov
Hi @ElenaGallo Thanks.
- [ ] Editing Pie and Bar charts with custom color allows to switch charts type but once changed to Line Chart the custom color on Pie and Bar charts are no longer enable
That's because the color classification is not available for line chart and hence when switching the data is overriden or removed. This is existing behavior (QA for reference)
- [ ] After inserting the filter to one of the two configured charts, opening the filter again, it is no longer visible
- [ ] After inserting the filter to one of the two configured charts, the second chart is no longer visible in the preview
- [ ] Once a new Pie Chart has been added to the list, the legend is visible even if the Display Legend option is not enable
I will check these ones
- [ ] If I add a new widget to a map, it is not visible on the map.
I couldn't reproduce this issue. The widget toolbar is enabled below, which probably means the chart widget is created but hidden behind the TOC. Could you please check this?
Hi @dsuren1,
I couldn't reproduce this issue. The widget toolbar is enabled below, which probably means the chart widget is created but hidden behind the TOC. Could you please check this?
you are right, the widget is behind the TOC
@dsuren1 I've also noticed that when I try to create a new chart on a existing widget using the same layer, that layer is disabled in the list while it should be enabled since it should be possible to select the same layer for a different charts configurations in the same widgets.
To be honest, I don't remember now the reason of this here.
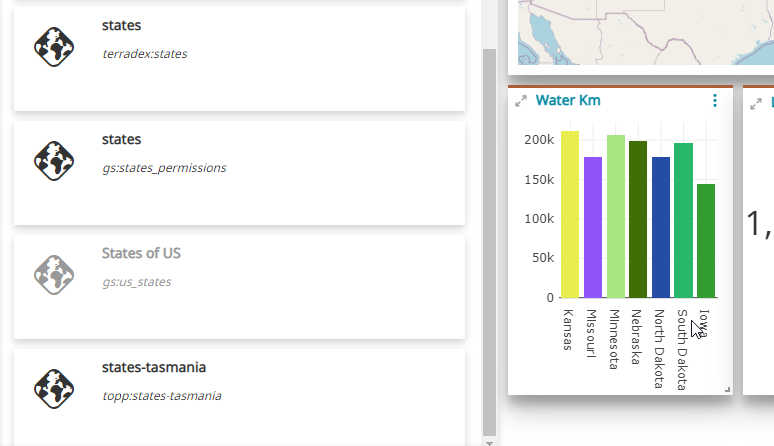
In the layer catalog, the previously selected layers will be disabled while giving user the option to select one or more layers on top of already selected layers [Screenshot-2]
Was there a specific constraints to prevent the use to select the same dataset for a different chart configuration?
It would be also good to allow the user to customize the chart name in dropdown instead of leaving the layer name. Let me know the effort please.
Finally:
I couldn't reproduce this issue. The widget toolbar is enabled below, which probably means the chart widget is created but hidden behind the TOC. Could you please check this?
you are right, the widget is behind the TOC
This should never happen. I tried it and I think this is a regression from the previous version @ElenaGallo @dsuren1! The widget must be visible when created and added to the map, it cannot be covered by the TOC. @ElenaGallo if you look at the release instance you can understand it is a regression. I don't think it is something introduced by @dsuren1 with this issue since the same is affecting also QA while this work has not backported yet to the stable branch. Maybe you can open a dedicated issue with regression label @ElenaGallo, assign it to me.
@tdipisa
To be honest, I don't remember now the reason of this here.
In the layer catalog, the previously selected layers will be disabled while giving user the option to select one or more layers on top of already selected layers [Screenshot-2]
Was there a specific constraints to prevent the use to select the same dataset for a different chart configuration?
Not that I can think of, during our brainstorming we decided go with disabling when adding new one on top of existing. I can modify it to allow user to add same layer during selection
It would be also good to allow the user to customize the chart name in dropdown instead of leaving the layer name. Let me know the effort please.
I think I should be able to complete by EOD today, this one including fixes for the ones mentioned above
@dsuren1
I think I should be able to complete by EOD today, this one including fixes for the ones mentioned above
Thank you. In that case please proceed with the above points. You can assign the review of the new PR to @allyoucanmap
@dsuren1
I think I should be able to complete by EOD today, this one including fixes for the ones mentioned above
Thank you. In that case please proceed with the above points.
FYI, so the flow goes like this for editing chart name,
- User selects more than one layer -> navigates to configure chart
- Drop down shows
Chart-1,Chart-2etc.. - An edit button will be present next to dropdown
- On clicking edit, the dropdown changes to input field to allow user to change the chart name
- Click ok next to the field, the dropdown is updated with new chart name