pyStock
 pyStock copied to clipboard
Stock fetcher & viewer (technical analysis). Report generation, sending and alarms.
Bumps [pillow](https://github.com/python-pillow/Pillow) from 9.3.0 to 10.2.0. Release notes Sourced from pillow's releases. 10.2.0 https://pillow.readthedocs.io/en/stable/releasenotes/10.2.0.html Changes Add keep_rgb option when saving JPEG to prevent conversion of RGB colorspace #7553 [@bgilbert] Trim...

Bumps [urllib3](https://github.com/urllib3/urllib3) from 1.26.5 to 1.26.18. Release notes Sourced from urllib3's releases. 1.26.18 Made body stripped from HTTP requests changing the request method to GET after HTTP 303 "See Other"...
Bumps [requests](https://github.com/psf/requests) from 2.24.0 to 2.31.0. Release notes Sourced from requests's releases. v2.31.0 2.31.0 (2023-05-22) Security Versions of Requests between v2.3.0 and v2.30.0 are vulnerable to potential forwarding of Proxy-Authorization...
if I try to launch with the command: ./stock-viewer.py -n AAPL.US -W -g -r i have this error: _IndexError: index -27 is out of bounds for axis 0 with size...
When generating the report, the main values in the file are empty. what can I do? 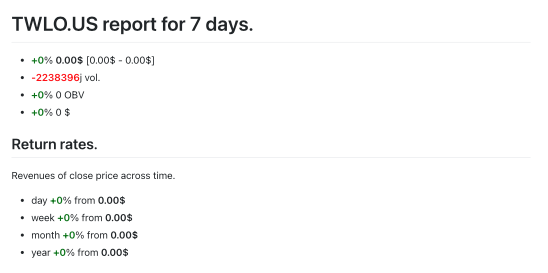
Candlestick patterns - check again all paterrns, if are correct! - Display only last 52 days of patterns,
Example code import matplotlib.pyplot as plt import numpy as np class Cursor(object): def __init__(self, ax): self.ax = ax self.lx = ax.axhline(color='k') # the horiz line self.ly = ax.axvline(color='k') # the...
1. Argparse - more arguments. * If one stock given then standard plotting. * If more stocks given then comparision plot. Add also option to rounding prices/values to n decimal...
* Collect datas of inidicators + user commentary, * Train AI on data to create commentary from plots, * Maybe commentary based on 'fuzzy logic' is enough,