explainx

explainx copied to clipboard
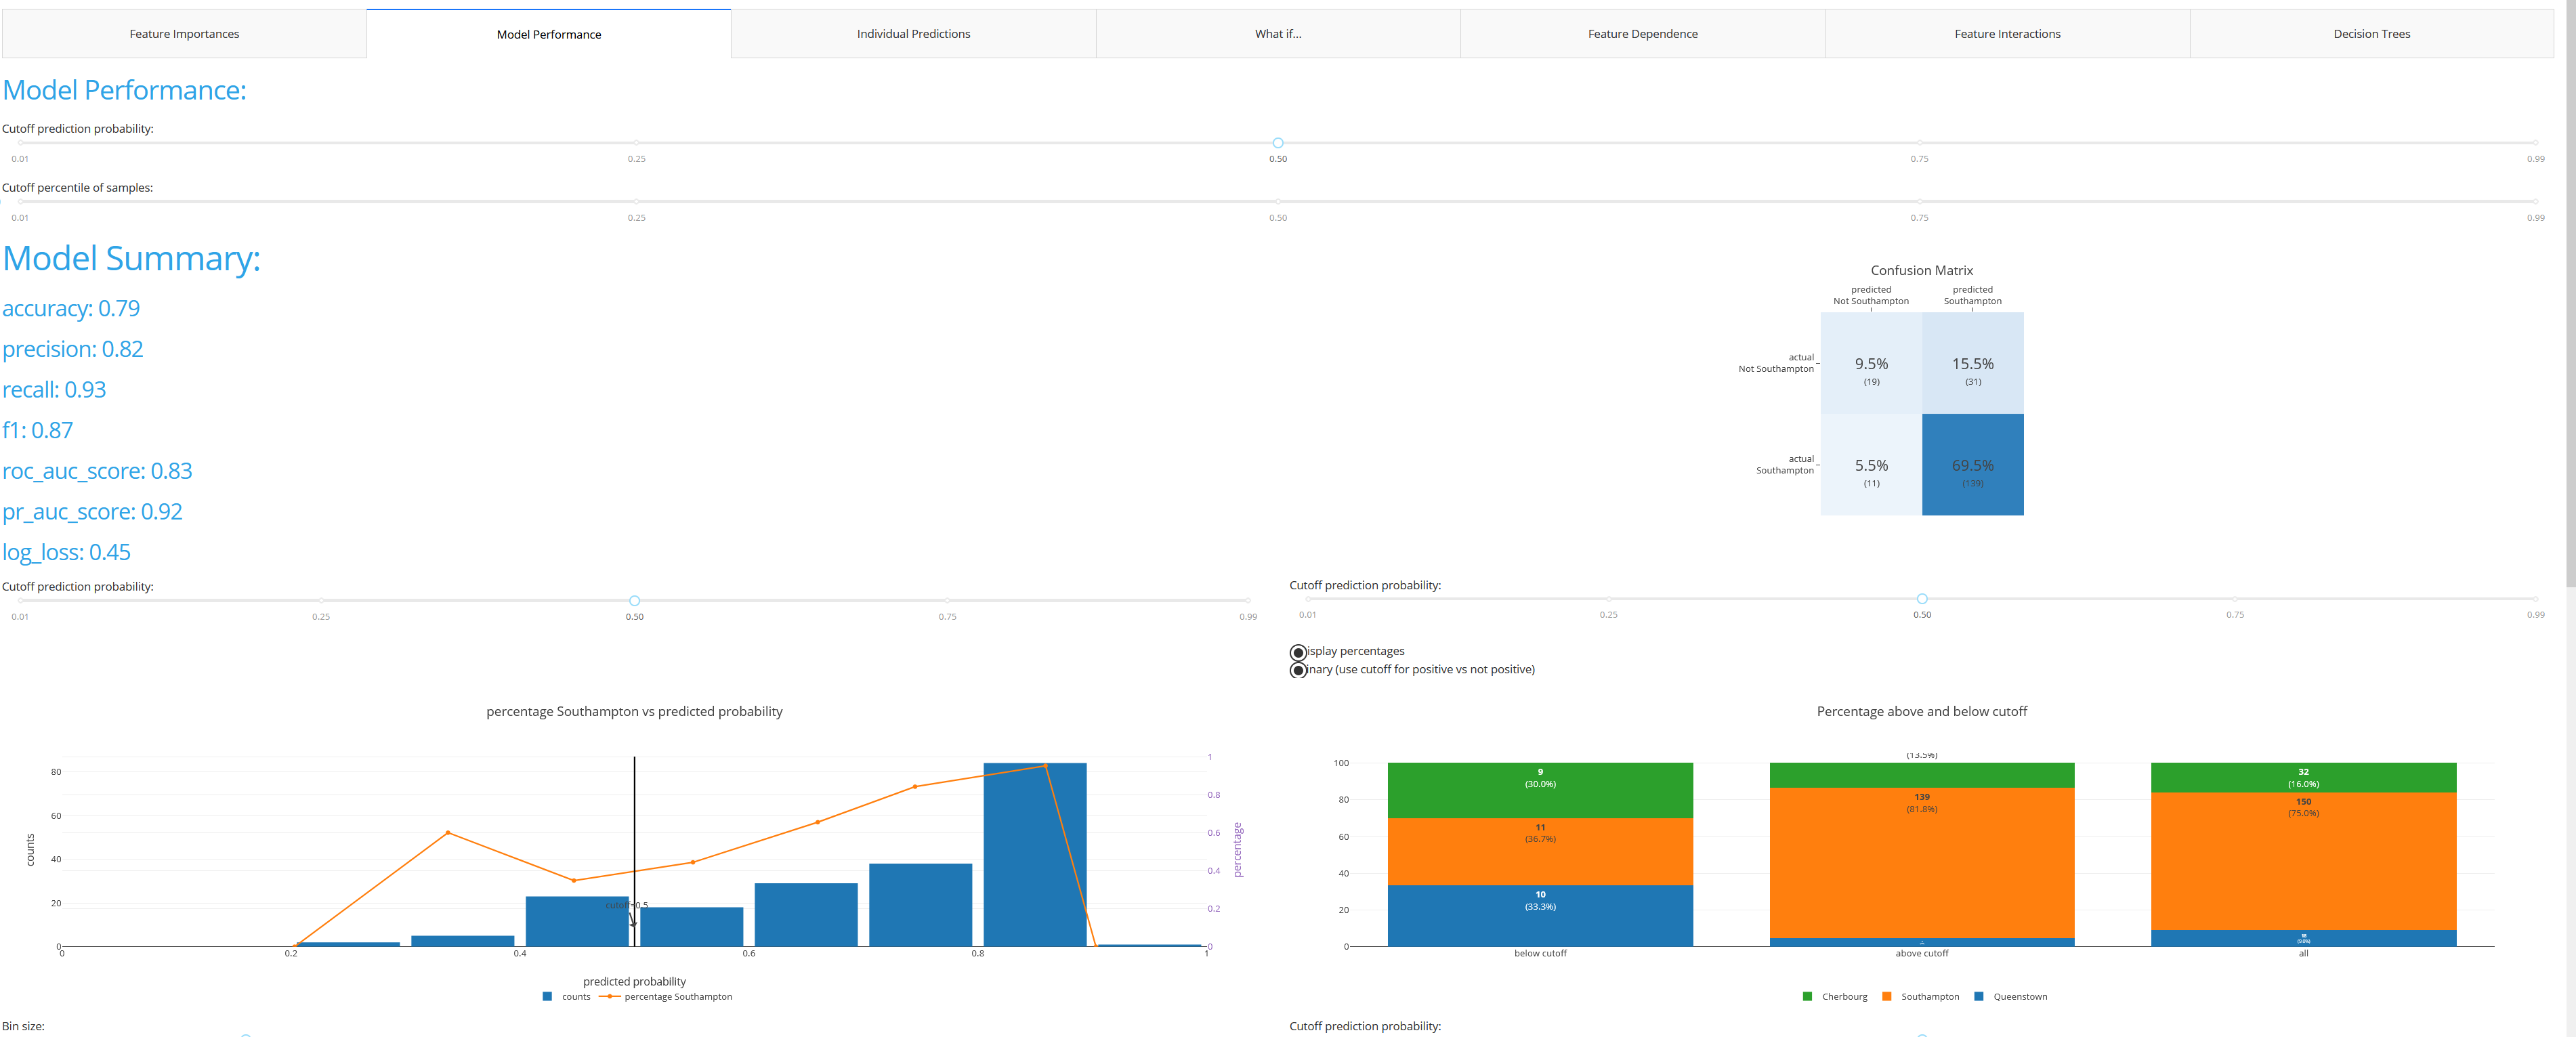
Adding a tab to show model performance
How about having a feature/tab to visualize model performance in terms of metrics (f1, precision, recall, MSE, MAE, R^2, etc.), confusing matrix, AUC, ROC, etc.?
A reference example could be a similar functinality provided by explainerdashboard (link: https://github.com/oegedijk/explainerdashboard)
Hi!
Thank you for this. This is definitely in our pipeline and we are building this module along with the monitoring part.
Will update this soon.