Histogram formatting odd for Integers
Bug Description
- Created a histogram with a range of data between 0-10.
- Integers are displayed as being "above" the bucket boundary
Expected Behavior
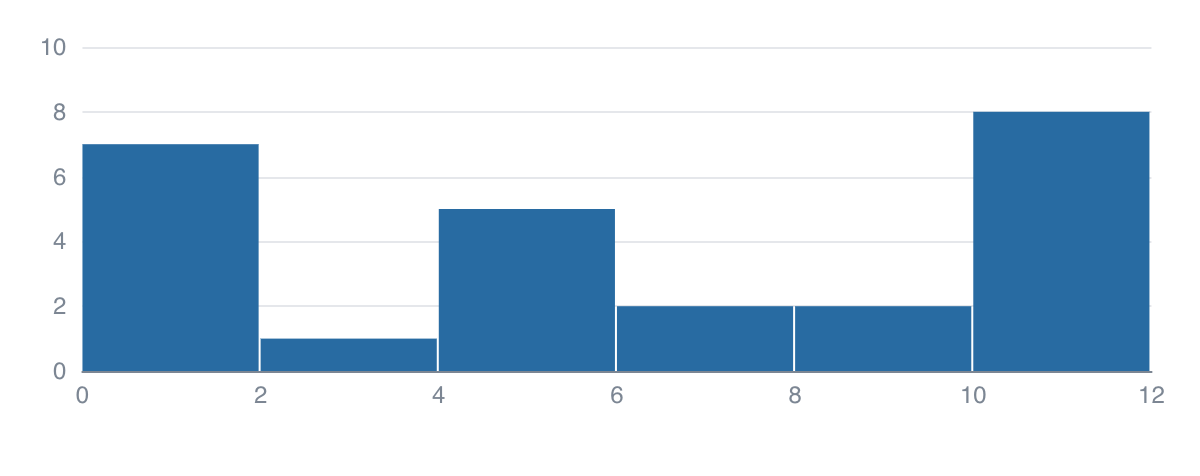
- Chart to show data is in range 1-10 eg in plotly:
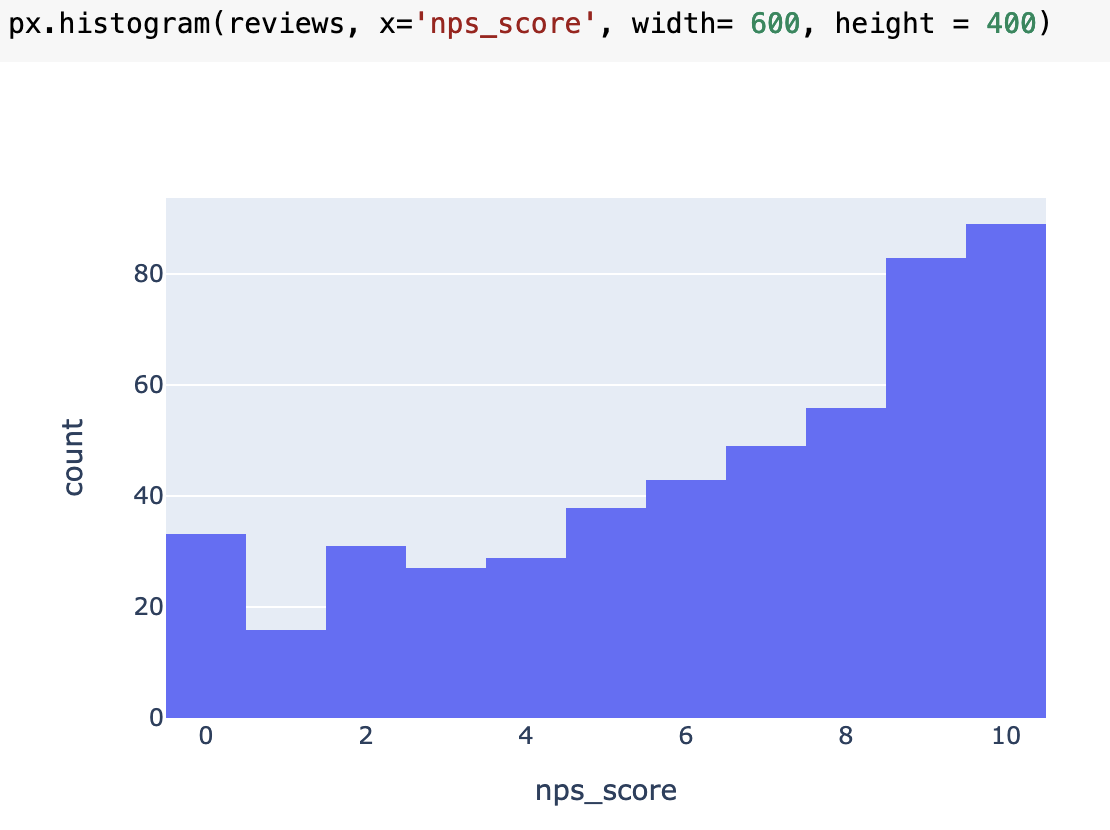
Error Messages and Screenshots
- Looks like integer results are in the 'Next' bucket due to position of x labels
- ie there is no data above 10, but in the chart it seems to be between 10 and 11
Steps To Reproduce
<script>
let full =
[
    {x: 0},{x: 0},{x: 0},{x: 0},{x: 1},{x: 1},{x: 1},{x: 2},{x: 4},{x: 4},{x: 4},{x: 5},{x: 5},{x: 6},{x: 7},{x: 8},{x: 9},{x: 10},{x: 10},{x: 10},{x: 10},{x: 10},{x: 10},{x: 10},{x: 10},
]
</script>

<Histogram data={full}/>
Workarounds
- Use a bar chart for small ranges like this
Though actually the bar chart styling could be improved in this case also. Very gappy either side.
<BarChart
    data={data.histogram}
    x=rating
    y=number_reviews
/>
Though this vanishes if you also add a series
<BarChart
data={data.histogram}
x=rating
y=number_reviews
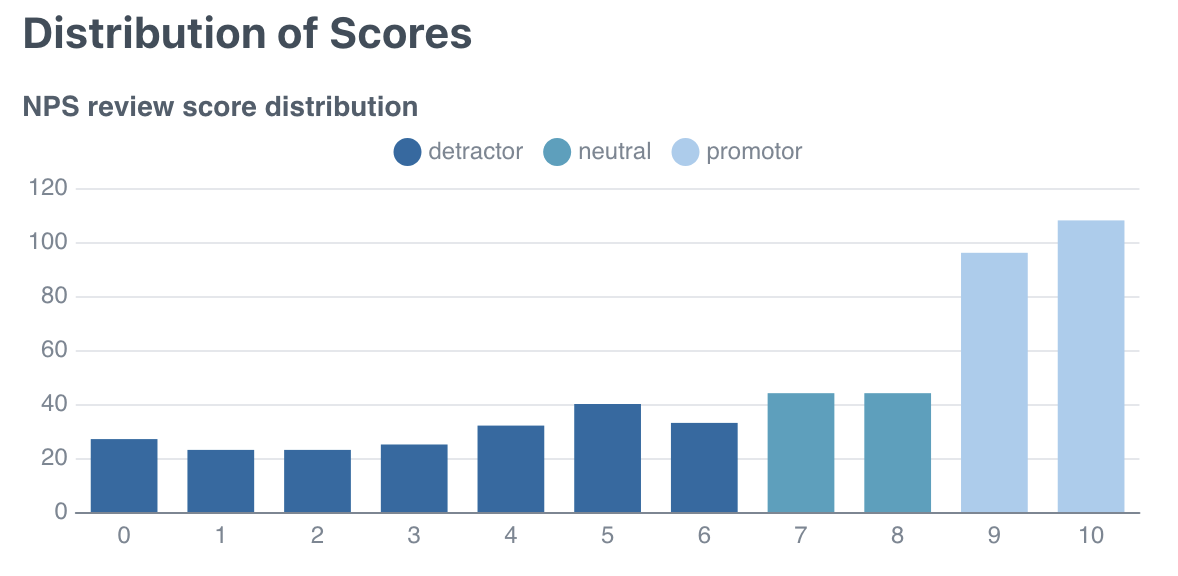
series=label
/>
Hello!
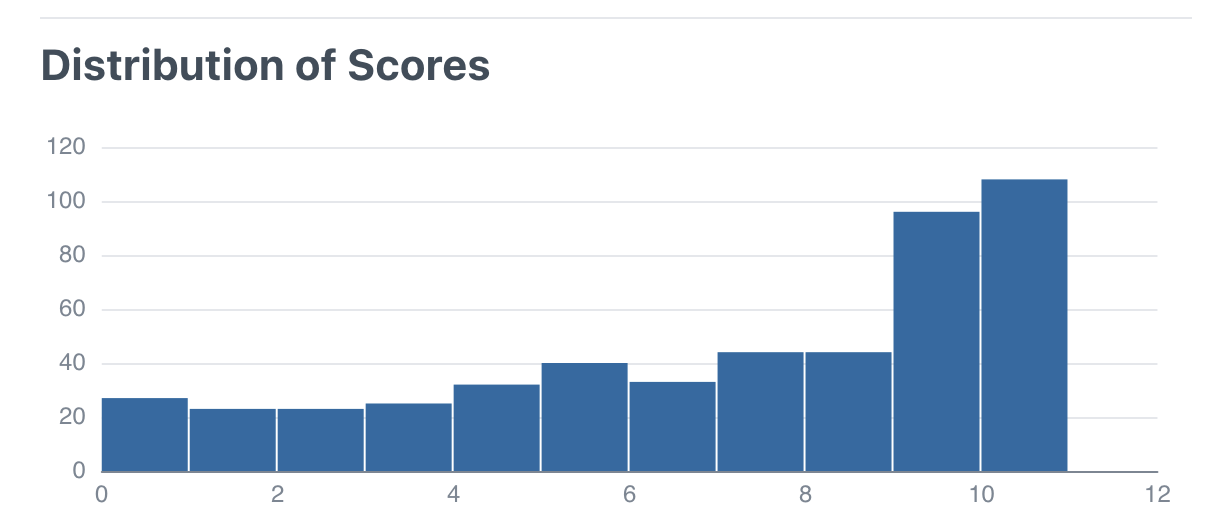
I tried following your steps to reproduce. This was what rendered for me:
I checked the values and it appears correct. I'm wondering if you can share more details in how you ended up with your chart instead?
It seems something has changed in Evidence since I logged this example. I should have included a repro link.
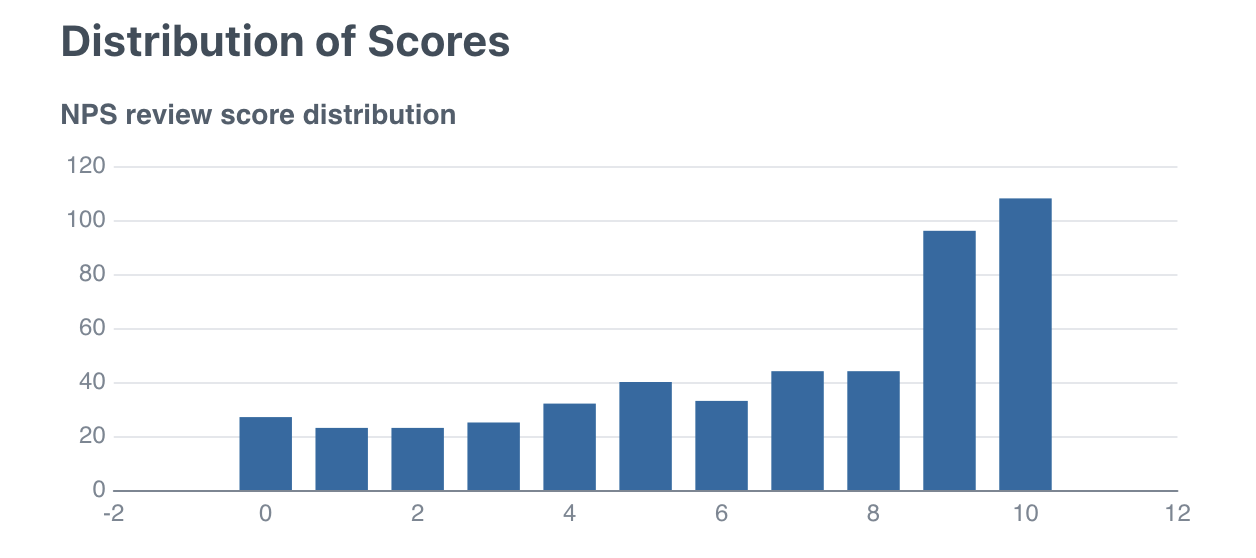
Here is a link illustrating the bug currently (with a slighltly modified dataset) https://stackblitz.com/edit/evidence-4y9kyn?file=pages%2Findex.md
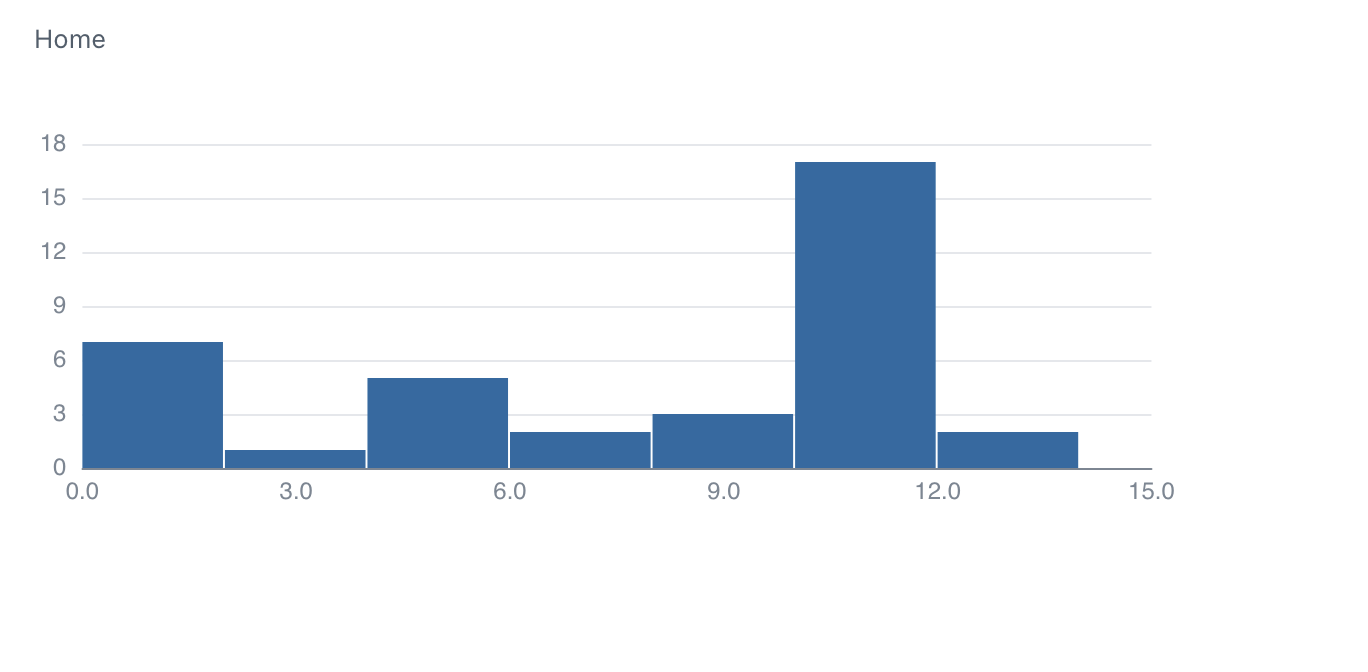
There are no datapoints above 12 in this dataset
Thanks! My viz looks the same as your recent one. I just want to clarify the issue more.
From what I understand, each bucket contains up to but not including its limit (ie. bucket 0-2 only includes values between 0-1.999..). So it makes sense to me for the last bucket (12-14) to have 2 values.
So is the problem the empty space between 14-15?
Thanks for your question! Good to clarify the thinking.
Sorry, I should have been clearer. The tooltip is accurate, and as you say, shows 2 values in 12-14.
The thing I find visually misleading is the x axis for integers. The implication of this alignment of the x axis is that there are values above 12, when in fact there are not. The values are exactly 12.
I think the correct behaviour in the case of only integers would probably be to align the x values in the center of the bars in this case (where dealing with integers at the edge of the bounds of the x axis.)
- This is the behaviour of the plotly example at the top of this issue
- You could think of this as having shifted the x axis 0.5 units to the left, relative to the data.
I guess implicitly we also need to decide how integers are plotted when placed when placed on an continuous scale, with non integer datapoints. If the range is 0<1 and 1-2, which bucket should you put 1.0 in?
Happy to hear other thoughts if this doesn't make sense!
Ok, I understand the issue better, thanks! I can see how the x-axis can be misleading. I agree we should make it match the plotly example (when using only integers).
In terms of bucket placement, however, I think 1.0 should belong in the 1<2 bucket and not the 0<1. That makes sense to me. I like the consistency of placement, so rather than having the buckets be:
0<1, 1-2, 2-3, ..., (n-1)<n
We keep it as:
0<1, 1<2, 2<3, ..., (n-1)<n
I hope that makes sense! But I'm down to hear if there are any issues with that.