Poor performance of envoy vs when we test inside the container
Hey, We have following envoy configuration:
admin:
  access_log_path: /tmp/admin_access.log
  address:
    socket_address:
      protocol: TCP
      address: 0.0.0.0
      port_value: 9901

static_resources:
  listeners:

  ################################################################################
  # HTTP listeners
  ################################################################################
  - name: http_listener
    address:
      socket_address:
        address: 0.0.0.0
        port_value: 80
    filter_chains:
    - filters:
      - name: envoy.filters.network.http_connection_manager
        typed_config:
          "@type": type.googleapis.com/envoy.extensions.filters.network.http_connection_manager.v3.HttpConnectionManager
          http_protocol_options:
            accept_http_10: true
          stat_prefix: ingress_http
          access_log:
          - name: envoy.access_loggers.stdout
            typed_config:
              "@type": type.googleapis.com/envoy.extensions.access_loggers.stream.v3.StdoutAccessLog
          http_filters:
          - name: envoy.filters.http.router
          route_config:
            name: services_route
            virtual_hosts:
            # example.com
            - name: example.com
              domains: ["example.com"]
              routes:
              - match: { prefix: "/" }

                route: { cluster: example_cluster }


  ################################################################################
  # Clusters
  ################################################################################
  clusters:

  # Cluster: example
  - name: example_cluster
    type: LOGICAL_DNS
    load_assignment:
      cluster_name: example_cluster
      endpoints:
      - lb_endpoints:
        - endpoint:
            address:
              socket_address:
                address: example
                port_value: 3000
When we bench mark the our example component inside the server (not inside the container) where the connection gets passed through the envoy proxy we see the following result:
$ ab -n1000 -c10 http://example.com/callback/eaa8d66b-b169-42cd-98c2-6c654f1d9175
This is ApacheBench, Version 2.3 <$Revision: 1843412 $>
Copyright 1996 Adam Twiss, Zeus Technology Ltd, http://www.zeustech.net/
Licensed to The Apache Software Foundation, http://www.apache.org/
Benchmarking vitatrk.com (be patient)
Completed 100 requests
Completed 200 requests
Completed 300 requests
Completed 400 requests
Completed 500 requests
Completed 600 requests
Completed 700 requests
Completed 800 requests
Completed 900 requests
Completed 1000 requests
Finished 1000 requests

Server Software:        cloudflare
Server Hostname:        example.com
Server Port:            80
Document Path:          /callback/eaa8d66b-b169-42cd-98c2-6c654f1d9175
Document Length:        0 bytes
Concurrency Level:      10
Time taken for tests:   13.514 seconds
Complete requests:      1000
Failed requests:        0
Non-2xx responses:      1000
Total transferred:      769800 bytes
HTML transferred:       0 bytes
Requests per second:    74.00 [#/sec] (mean)
Time per request:       135.144 [ms] (mean)
Time per request:       13.514 [ms] (mean, across all concurrent requests)
Transfer rate:          55.63 [Kbytes/sec] received
Connection Times (ms)
              min  mean[+/-sd] median   max
Connect:        8   10   0.8     10      15
Processing:    26  124 105.5     44     292
Waiting:       26   37   8.1     36      98
Total:         34  134 105.5     55     302
Percentage of the requests served within a certain time (ms)
  50%     55
  66%    253
  75%    258
  80%    261
  90%    267
  95%    271
  98%    277
  99%    282
 100%    302 (longest request)
But when we run the same test INSIDE the container itself we see the following result:
root@74bc950be281:/dist# ab -n1000 -c10 http://0:3000/callback/eaa8d66b-b169-42cd-98c2-6c654f1d9175
This is ApacheBench, Version 2.3 <$Revision: 1843412 $>
Copyright 1996 Adam Twiss, Zeus Technology Ltd, http://www.zeustech.net/
Licensed to The Apache Software Foundation, http://www.apache.org/
Benchmarking 0 (be patient)
Completed 100 requests
Completed 200 requests
Completed 300 requests
Completed 400 requests
Completed 500 requests
Completed 600 requests
Completed 700 requests
Completed 800 requests
Completed 900 requests
Completed 1000 requests
Finished 1000 requests

Server Software:
Server Hostname:        0
Server Port:            3000
Document Path:          /callback/eaa8d66b-b169-42cd-98c2-6c654f1d9175
Document Length:        0 bytes
Concurrency Level:      10
Time taken for tests:   2.120 seconds
Complete requests:      1000
Failed requests:        0
Non-2xx responses:      1000
Total transferred:      255000 bytes
HTML transferred:       0 bytes
Requests per second:    471.62 [#/sec] (mean)
Time per request:       21.203 [ms] (mean)
Time per request:       2.120 [ms] (mean, across all concurrent requests)
Transfer rate:          117.44 [Kbytes/sec] received
Connection Times (ms)
              min  mean[+/-sd] median   max
Connect:        0    0   0.0      0       1
Processing:     5   21   6.5     20      57
Waiting:        4   21   6.5     20      57
Total:          5   21   6.5     20      57
Percentage of the requests served within a certain time (ms)
  50%     20
  66%     23
  75%     25
  80%     26
  90%     30
  95%     34
  98%     38
  99%     41
 100%     57 (longest request)
As you can see both are trying to connect through HTTP protocol and we run only 1 instance of the container but when we have the envoy as the middleware to proxy the traffic to our container we have 74 RPS (Request Per Second) throughput but when we perform the same test inside the container we have 471 RPS which is almost 7 times faster.
Also, we can see the mean processing time when we test with envoy as middleware is 124ms but when we perform the test inside the container it's 21ms obviously envoy adds ~100ms to the processing time.
The envoy version we use: v1.20.1
I wonder to know if we are doing something wrong in the envoy's configuration or not. why does envoy as middleware slows down the throughput? because we ran both tests in the same condition, one instance, HTTP protocol, same testing configuration! why we observe such a behaviour?
Could you provide some more detailed description of inside the server and inside the container?
Does inside the container mean that running bench client in the server's container directly?
100ms variance seems more like some network performance problem. 🤔
And it would be better to provide some profile result which would be very helpful to analyze the performance problem.
Thanks for the reply, before I provide more detailed description of inside the server and inside the container I need to ask what kind of profile result do you mean? what tools I need to use in order to extract the profile that is required for analyzing the performance problem?
Does
inside the containermean that running bench client in the server's container directly?
Yes exactly, I logged in into the container via command sudo docker exec -it 74bc950be281 bash and performed the ab -n1000 -c10 http://0:3000/callback/eaa8d66b-b169-42cd-98c2-6c654f1d9175 command which connects directly to the container's program which listens to the port 3000.
Inside the server I mean I ran the ab -n1000 -c10 http://example.com/callback/eaa8d66b-b169-42cd-98c2-6c654f1d9175 inside the server that the mentioned container and envoy image is running at (to avoid network latency factor for our testing) so it looks for DNS then it sends the request to envoy at port 80 and envoy proxies that traffic to the container at port 3000.
May be a linux perf? Please make sure that a non-stripped envoy binary is used.
If you have a build farm for envoy, you can also rebuild envoy with gperftools. Check doc here https://github.com/envoyproxy/envoy/blob/main/bazel/PPROF.md.
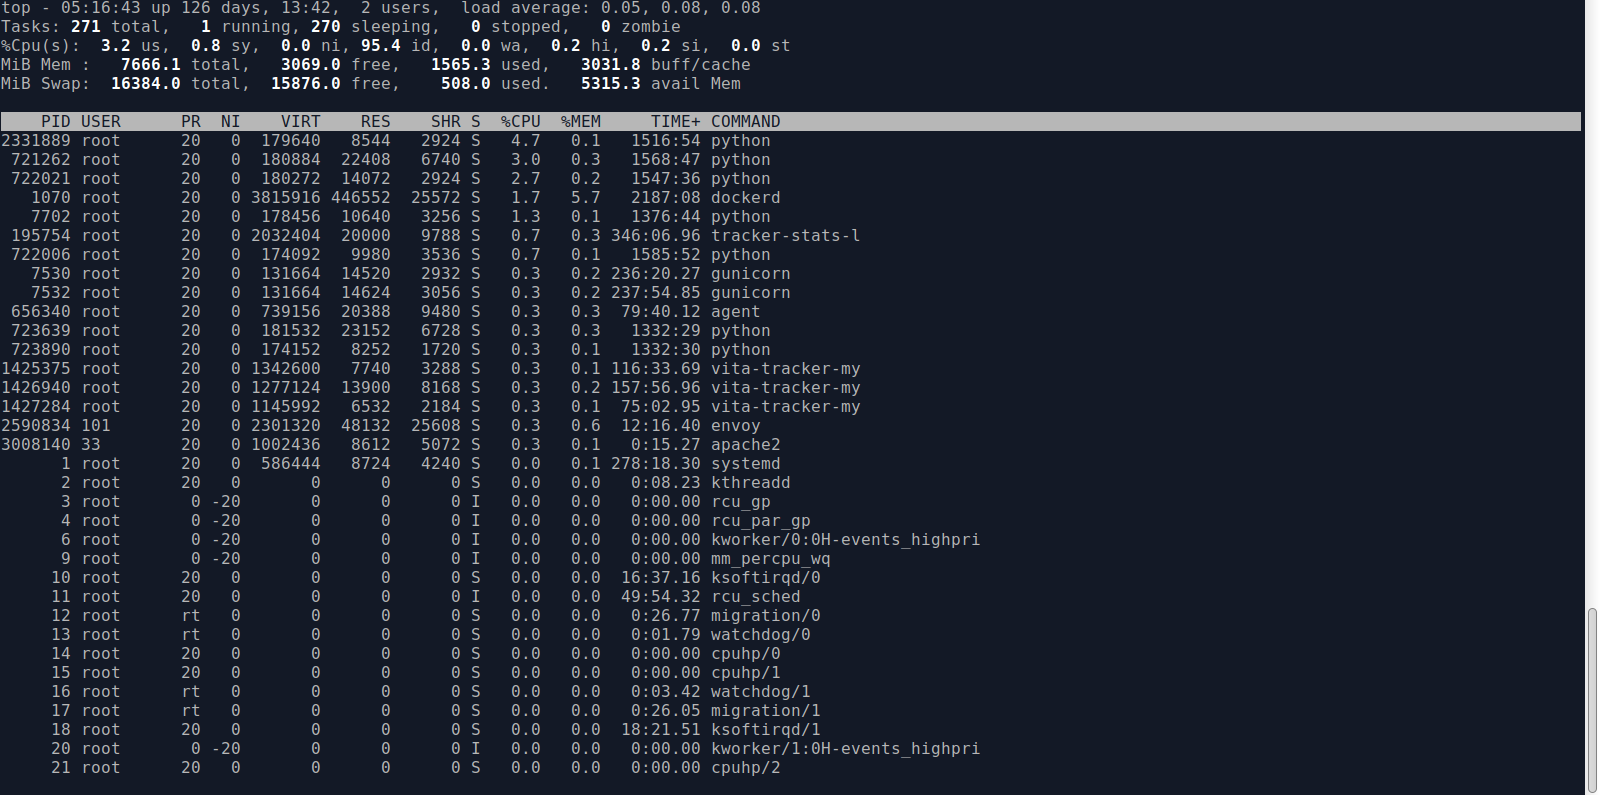
Typically, the direct localhost access is faster than the container network. But 100ms lantency is too high. Could you provide your CPU overhead (by simple top command?) of envoy when you run the benchmark also?
@alphamarket It looks more likely the bottleneck is the path between requests client and the container port, because in your case the Envoy always works the same way. Please check if there is any problem with the intermediate path.
@wbpcode
top output while performing the benchmark:
perf output while performing the benchmark: envoy.perf.txt
We have deployed the envoy using docker-swarm with the following configuration, we haven't built it from the source code:
  envoy:
    image: envoyproxy/envoy:v1.20.1
    deploy:
      replicas: 1
      placement:
        constraints: [node.role == manager]
      update_config:
        parallelism: 1
        delay: 30s
        order: start-first
    ports:
      - "9901:9901"
      - "80:80"
      - "443:443"
    volumes:
      - ./envoy.yaml:/etc/envoy/envoy.yaml
      - ./certs:/etc/ssl/certs
@gyohuangxin There is no middleware between Envoy and the container we have deployed the Envoy using the docker-swarm and we address the container as the configuration I sent in the first post in this issue. Worth to mention that we have deployed it in the AWS infrastructure.
@wbpcode An update: when I opened the port of 3000 inside the docker-swarm and I connected to the container itself inside the server the throughput was almost the same as the one I did inside the server, introducing the envoy in middle is the causing the issue... I can confirm this
$ ab -n1000 -c10 http://0:3000/callback/eaa8d66b-b169-42cd-98c2-6c654f1d9175
This is ApacheBench, Version 2.3 <$Revision: 1843412 $>
Copyright 1996 Adam Twiss, Zeus Technology Ltd, http://www.zeustech.net/
Licensed to The Apache Software Foundation, http://www.apache.org/

Benchmarking 0 (be patient)
Completed 100 requests
Completed 200 requests
Completed 300 requests
Completed 400 requests
Completed 500 requests
Completed 600 requests
Completed 700 requests
Completed 800 requests
Completed 900 requests
Completed 1000 requests
Finished 1000 requests


Server Software:
Server Hostname:        0
Server Port:            3000

Document Path:          /callback/eaa8d66b-b169-42cd-98c2-6c654f1d9175
Document Length:        0 bytes

Concurrency Level:      10
Time taken for tests:   4.055 seconds
Complete requests:      1000
Failed requests:        0
Non-2xx responses:      1000
Total transferred:      255000 bytes
HTML transferred:       0 bytes
Requests per second:    246.59 [#/sec] (mean)
Time per request:       40.553 [ms] (mean)
Time per request:       4.055 [ms] (mean, across all concurrent requests)
Transfer rate:          61.41 [Kbytes/sec] received

Connection Times (ms)
              min  mean[+/-sd] median   max
Connect:        0    0   0.0      0       0
Processing:    10   40  34.1     33     513
Waiting:       10   40  34.1     32     513
Total:         10   40  34.1     33     513

Percentage of the requests served within a certain time (ms)
  50%     33
  66%     38
  75%     43
  80%     46
  90%     59
  95%     82
  98%    155
  99%    184
 100%    513 (longest request)
The above test was done inside the server not the container itself. you can see the processing time is close to the one that we observed during the test we performed inside the container.
Worth to mention that the server is deployed in the AWS, so I really doubt that we have a networking issue here... :/
20ms is also big variation for just moving the client from container to server.
By the way, which HTTP protocol is used in your test? If the long connection is used? Could you add a -k to the benchmark to used keep-alive or change the bench tools to hey/wrk or our nighthawk(https://github.com/envoyproxy/nighthawk)?
This issue has been automatically marked as stale because it has not had activity in the last 30 days. It will be closed in the next 7 days unless it is tagged "help wanted" or "no stalebot" or other activity occurs. Thank you for your contributions.
This issue has been automatically closed because it has not had activity in the last 37 days. If this issue is still valid, please ping a maintainer and ask them to label it as "help wanted" or "no stalebot". Thank you for your contributions.