Memory Leak when updating axis ranges on the order of 30MB/hour
Problem Description

Updating the the plot data and plot axis range causes a memory leak when manually set. For long-running applications this will eventually crash the process with a MemoryError as all memory will be consumed.
The following data shows the leak is dependent on plot refresh rate.
- 60Hz update rate causes leak of ~30MB/hr
- 30Hz update rate causes leak of ~15MB/hr
Reproduction Steps:
Please see repo. here with code reproducing the problem and Jupyter notebook for data analysis.
Call the following code in a loop with different x and y data.
        # `plot_data` is instance of ArrayPlotData
        # `plot` is instance of Plot
        # `new_x` and `new_y` are are numpy arrays
        plot_data.set_data("x", new_x)
        plot_data.set_data("y", new_y)
        plot.range2d.x_range.low = new_xmin
        plot.range2d.x_range.high = new_xmax
        plot.range2d.y_range.low = new_ymin
        plot.range2d.y_range.high = new_ymax
Expected behavior:
Refreshing the plot data should not leak memory; long running applications should not crash with MemoryError.
OS, Python version:
- Windows 7, Windows 10, Windows Server 2012 R2
- Python 2.7.8
- wx 2.8.12.1
- traits 4.5.0
- traitsui 4.5.1
- chaco 4.5.0
- enable 4.5.1
- kiva 4.5.1
- pyface 4.5.2
Thanks for the report. Especially for the example code and clear indication of the problem. A couple of questions which may help narrow down the causes:
- which Kiva backend are you using? (probably "image" if you don't know)
- do you see similar behaviour when running under Qt4 (either Pyside or PyQt4)?
The other thing I immediately notice is that your driving loop is in a separate thread with no attempt to integrate updates with the Wx event loop. This may be why you are having to manually reset the bounds, which is something that Chaco will normally handle automatically when you call set_data (using Trait listeners). It also may mean that you get unlucky with when the updates happen and it interrupts what Wx is doing in the other thread in some way, which may potentially lead to memory leaks over time.
A better way to handle this sort of loop is to use a GUI timer (eg. from pyface.timer.api or using the invoke_after method of a pyface.gui.GUI), something like:
if __name__ == '__main__':
    from pyface.timer.api import Timer

    def update_loop(line_plot):
        iter_idx = 0
        line_plot.update_data()
        # shouldn't need this
        # line_plot.autoscale_axis()

    def log_memory():
        # log memory usage
        usage = float(psutil.Process(os.getpid()).memory_info().rss)*1e-6
        info = '#[{}] MB:{:f}'.format(iter_idx, usage)
        logger.warning(info)

    plot = LinePlot()
    millisecs = int(1000.0/30.0)  # ~30Hz
    timer = Timer(millisecs, update_loop, plot)
    timer = Timer(millisecs*1000, log_memory)
    plot.configure_traits()
The above is untested code, but it would be worth re-running with this in place to see if the leaks still happen.
Hello @corranwebster currently testing the leak test script with Timers!
which Kiva backend are you using? (probably "image" if you don't know)
kiva = 4.5.1
do you see similar behavior when running under Qt4 (either Pyside or PyQt4)?
I cannot run QT immediately (don't have a Python environment for that because the wider application is confined to traits + wx).
The other thing I immediately notice is that your driving loop is in a separate thread with no attempt to integrate updates with the Wx event loop.
With the timer architecture you proposed, the view would periodically pick up an update when the timer triggers.
The architecture that I currently have (for the wider application) is different. When a model updates a trait notification fires and this updates the data source - triggering the redraw. So the thread which initiated the update could be one of many (multithreaded application). Is it possible to have thread-safe updates and also use conventional trait notifications? Or would it be a case of writing the application to use timers?
Results from updating plot using timers.
Thanks for the advice on threading in a way that respects the UI thread. Take a look in the repo. I added the Timer in this commit
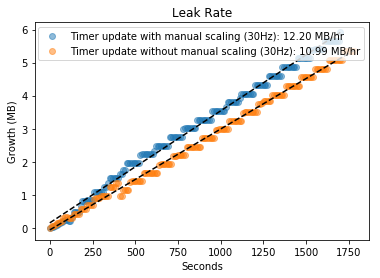
It seems that this leaks at a similar rate to the threaded update method. Also it seems that updating the axis ranges manually leaks more...
Thanks for the update. If I have some spare cycles in the next couple of days I may try to run your code under Qt to see if that makes a difference; and I may try a different Kiva backend (like 'celiagg' or 'qpainter') to see if that makes a difference.
The most likely candidate for a leak at this point is probably either something in Wx not being garbage-collected properly, or the SWIG-wrapped Agg having a bug.
I would really appreciate that! As you can imagine it is really limiting us from producing stable long-running software.
I've played around with this a bit, and I can seem to replicate similar behaviour on Qt and with different backends on OS X. I haven't compared the rates properly yet, but things seem to be on the same order of magnitude.
Although I don't think that these are the issue here, I'd strongly recommend upgrading to Traits 4.6 as there have been some genuine memory leaks fixed in Traits since Traits 4.5 was released. Similarly WxPython 2.8 is extremely old; we've just released TraitsUI 6 and I think there is a newer version of Enable and Chaco, and all of these have improvements to stability etc.
That said, I don't think any of these is the issue, as I am running on more recent versions of everything and am still seeing some of this behaviour.
Things which can be ruled out:
- this is not caused by leaking objects (eg. a refcounting bug somewhere) By looking at
gc.objects()and forcing garbage collection during the logging step you can see that the total number of Python objects fluctuates but is generally stable. - this is probably not a WxPython, Traits, or TraitsUI issue, as we are seeing things on different platforms and backends.
- it could still be an issue with the Agg wrapper, most of the backends rely on the Agg wrapper for handling raster images. We have a new Cython-based Agg wrapper for Kiva so I will have a look seeing if it happens with that backend as well.
Even with the Chaco UI turned off completely, and also with updates turned off, I am seeing a slow ticking up of memory usage, not at the same rate as with the UI turned on, but it is there.
So I am a little bit stumped here. I will discuss with colleagues here to see if they have any thoughts.
I will see what we can do at our end to update to more modern versions. Thanks for the time you are putting into this. Yes, it is perculiar and actually took quite a lot of effort already to track down and isolate to the calls mentioned here. Looking forward to learning more!
I looked into this a bit more with Guppy and Heapy; the object counts and memory they use remain fairly constant over time, so at this point whatever the issue is, it's not in the Python code directly.
On further reading, possible causes are still:
- a bug in the SWIG Agg wrappers.
- arena fragmentation or heap fragmentation
- something else.
An interesting read on tracking down these sorts of issues for Windows in particular can be found here: https://benbernardblog.com/tracking-down-a-freaky-python-memory-leak/
Thanks for looking into that more @corranwebster. Whats the likelihood that this is 'fixable' i.e. will it make it's way into someones to-do list at some point, or, is this more of an upstream issue? My solution is at the moment is to never update the plot automatically (manual refresh) which is not a great long term solution and not a good user experience. Or if there is another workaround I would do that.
If this is a bug in the Agg wrappers, the likely way forward for Chaco is to replace the current SWIG Agg wrappers with Celiagg for the image backend in Kiva/Enable, which I would imagine happening in the next major release of Enable. But that may be some time away.
The second thing to consider is whether this memory growth is causing an actual problem. We know that the number of Python objects which is allocated is more-or-less stable, so although the virtual memory size may be growing, the actual memory used is much smaller, and the end result on a modern OS is that excess unused memory gets paged out and not used; it consumes some disk space, but that is all. However if you are seeing crashes with out of memory errors after sufficient time (rough estimate is depending on your machine size, maybe 10-ish days of full time running), then that is a problem.
If it is something like heap fragmentation it will require a re-architecting of your application: in that case the problem is the allocation and deallocation of python objects interleaved with malloc and free of large-ish numpy arrays. I imagine (but have not tested) that if you were to change your test program so that instead of creating new random arrays it instead were to replace the values in the existing arrays with new values (since the size of the data set is not increasing) on update that this might greatly reduce or eliminate the problem.
Finally, there may be some immediate changes to ameliorate the problem. Reducing the refresh rate to ~1 sec might be acceptable for your users if you don't need the full 30Hz refresh rate (crashing with out of memory after a year may be acceptable, where 10 days is not). If changing the plot bounds seems to be part of the problem, are there reasonable numbers that you can use as pre-computed fixed bounds? Do things get better (or worse) if you turn on use_backbuffer on your Plot?
Yes, this bug was crashing the application. The OS would kill it when the allocation reached several GBs.
I implemented a workaround by changing the application's UI to never auto-range the plot (requires a button click). Thanks for the additional comments and apologies for not replying in the last few years!
I will probably test this out with the latest version of TraitsUI and the Qt backend soon.
This is no longer an issue for me, because of the workaround, so I'll leave this up to you if you want to close it or keep it open.