New monitor: column values distribution
The feature is a new monitor for column anomalies detection.
Monitor goal: Detecting a change in the distribution of the different values in a column.
Example: An example would be an orders table which represents orders placed across multiple stores. There's a column in the table which represents the store the order was placed in. We'd then want to have a test fail if the count of orders by day for a store dropped significantly below the typical value for that store. Something along the lines of:
select column_name, count(*)
from table
group by column_name
Possible implementations: Package:
- Add new CTE in the current column_monitoring_query
- Create a new query for this test, and add it to the flow of test_column_anomalies Anomaly detection does not need to change to support this.
CLI: We need to think about how to present it in the UI. Currently, we have a metric graph for each monitor+column. This test will output a metric per value+monitor+column.
Goal: We want to monitor the frequency of field values and alerts on unexpected changes in the distribution. This test would be a good fit for low-cardinality fields.
Task Overview All the changes are in the dbt package (https://github.com/elementary-data/dbt-data-reliability).
- Suggested name for monitor: values_distribution
- Implementation has 2 parts:
- Create monitoring query
- Add monitor to column test flow
- The current ‘column_monitoring_query’ is not designed to support this, so the best solution would be to create a dedicated test query that would have similar input and output formats, but implements the relevant logic.
- Add this monitoring query to the test_column_anomalies test, to be activated in case the monitor was configured or as a completely separated test?
Design
Part 1:
- Under ‘macros/edr/data_monitoring/monitors_query’ we should create a new macro, that creates the query ‘values_distribution_query’.
- The first CTE would be identical to ‘column_monitoring_query’, as it returns the column values and bucket for each value. Then we should apply the logic of count grouped by bucket and value. The final CTE should have the same fields as ‘column_monitoring_query‘.
- We would use the ‘source_value’ field for the value, the ‘metric_value’ field for the count, and the ‘metric_name’ value should be ‘values_distribution’. Note that the ID for each metric should include the ‘source_value’ as well, for the metric per each bucket+table+column+value to be unique.
Part 2:
- TBD, we plan to refactor this part of the code, and design is still not completed. If we don’t finish soon we would implement in the existing flow and change as part of the refactor.
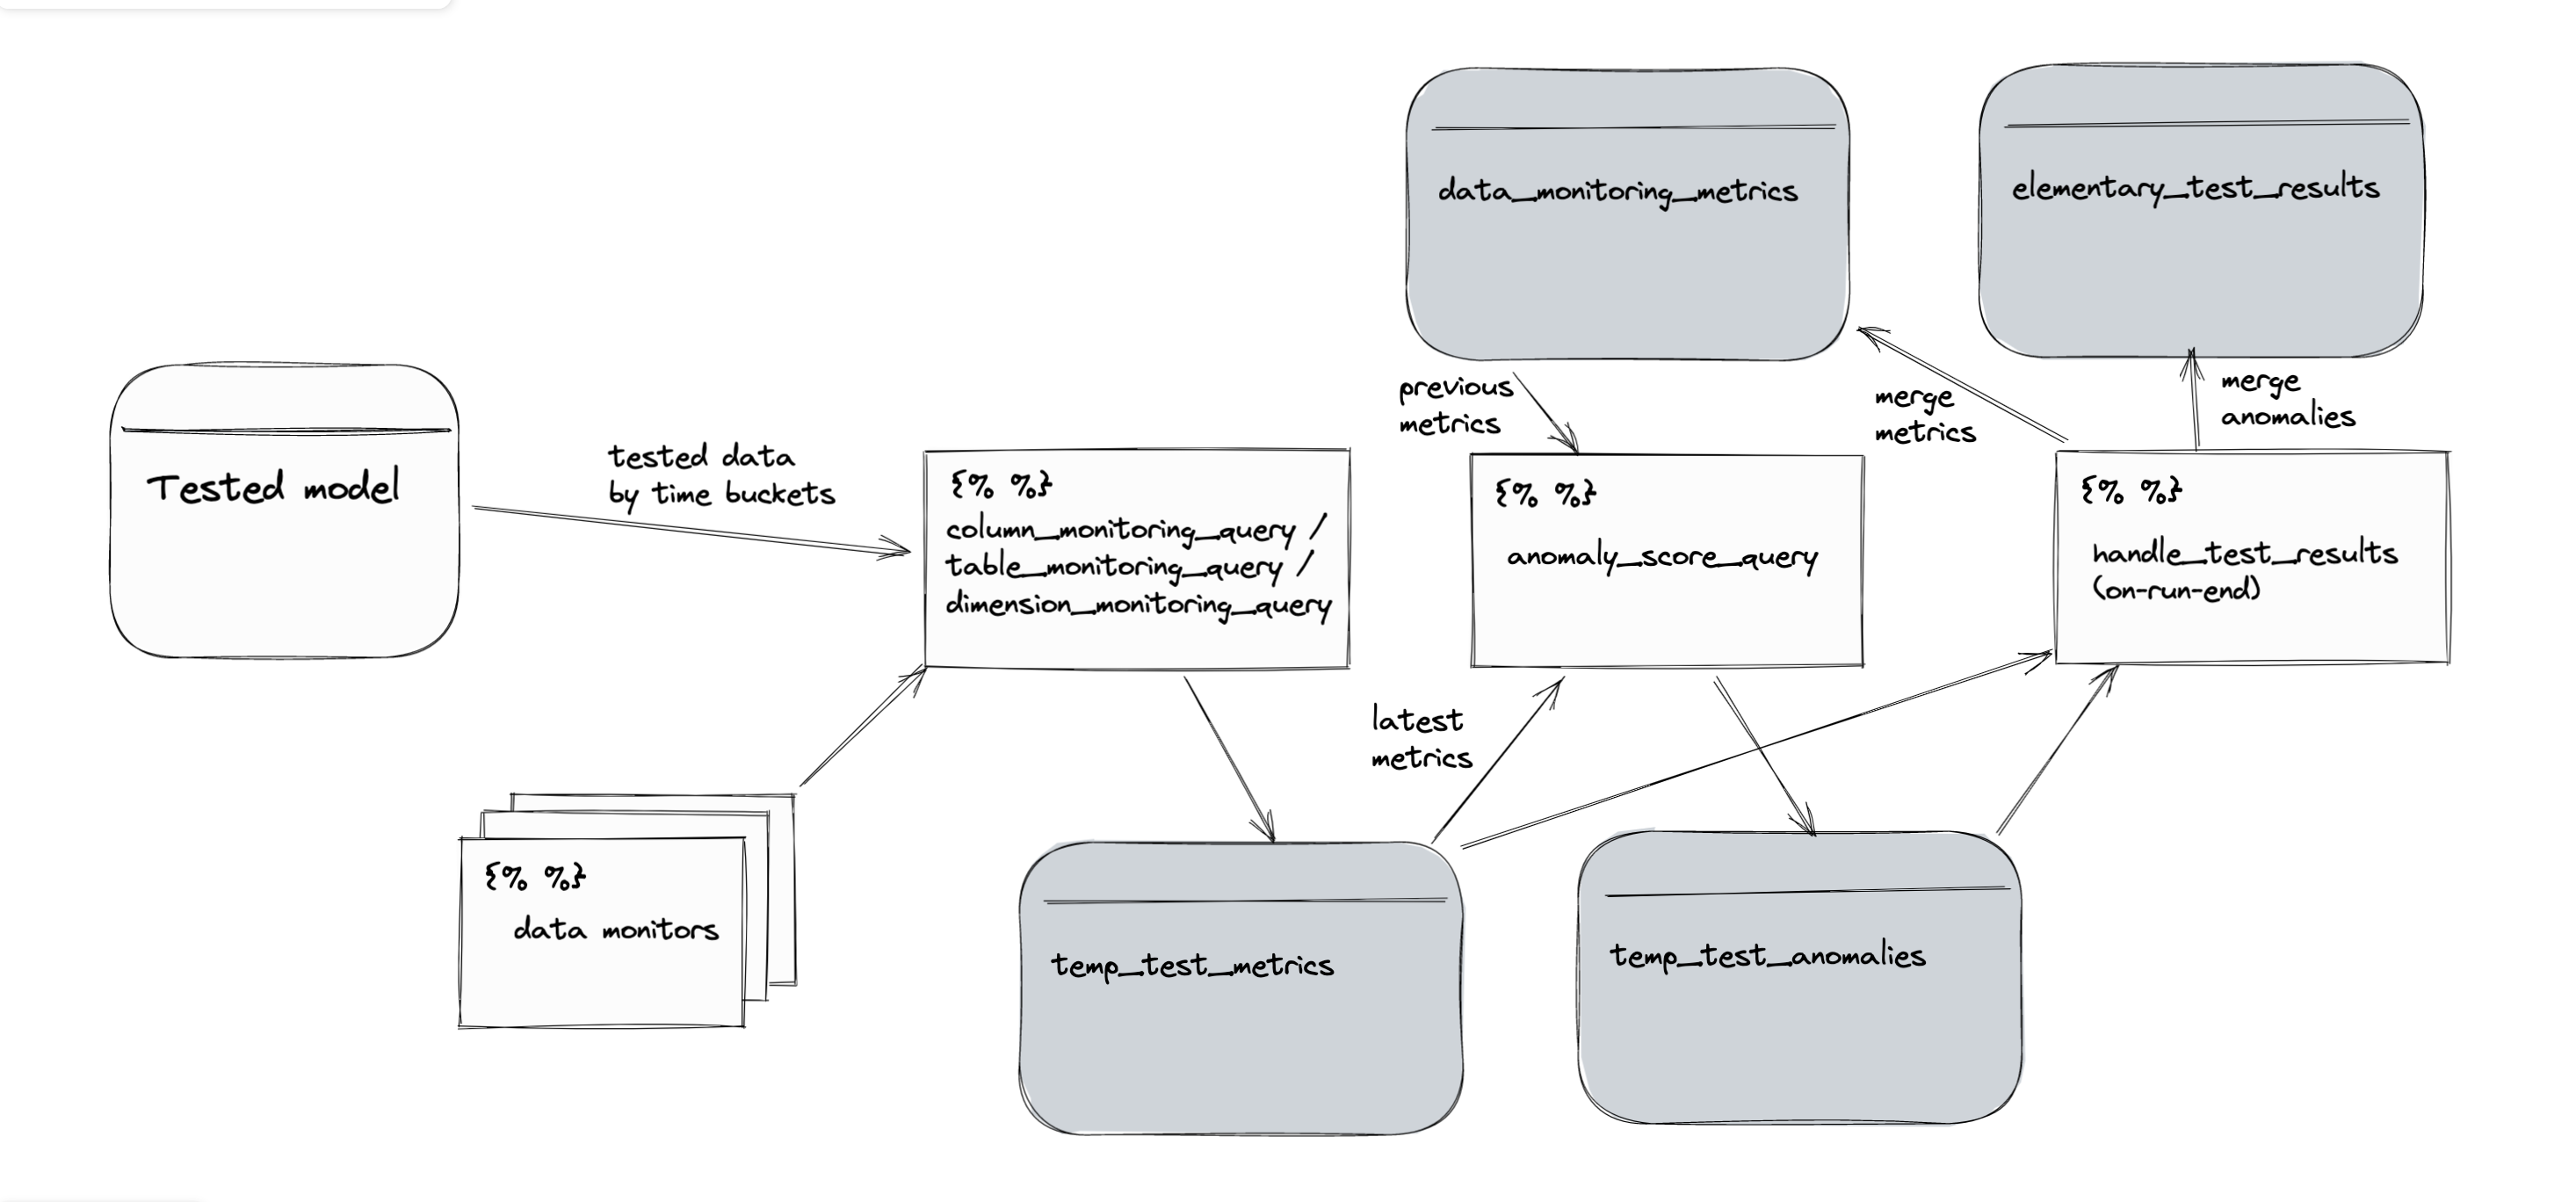
Here is the tests flow for ref:
A couple of other thoughts:
- If it's going go be easy to make this test support an arbitrary SQL expression to group by rather than assuming a column will be passed, let's do that. That would then allow users to pass two columns
column_a, column_bwhich can be grouped on, or even an expression likesubstr(column_a, 3). Monte Carlo supports this today in their dimension tracking monitor. - Do we necessarily need to make another monitor type/macro, or could it be an extension of the existing column monitor logic? We could add the
countaggregate function to the existing column level monitors, and add the ability to track anomalies by an arbitrary expression on the table, adding that extra granularity to the historic state table and look up logic
Oh wow, great suggestions! Thank you @NiallRees!
- The test would have to assume a column, as it's a dbt test (has to be defined on a column or model). However, we can add the use cases you mentioned as test params, and support with if statements in the query itself. So we will have a column as a basic definition. A param for adding another column to group by (or even a list of columns), and a param that is a column_expression (if passed, used this and not column). What do you think?
- This is actually really interesting. What you are suggesting is making it a 'dimension_monitoring_query' that can run the monitors of a column just like 'column_monitoring_query' does, but group by value. This can be implemented in the same query with some if conditions. I think it would be clearer as a test of it's own (even if it's the same query), so in the config, users could either define a 'column_anomalies' test or a 'dimension_anomalies' test. @oravi what do you recommend? I think a new query would simplify, although it's code duplication (just because the query is already complicated as it is)
- Makes total sense. It sounds like it could be good to make this both a model level test for arbitrary user defined grouping expressions (across multiple columns or the substr example above), and perhaps also a column level test for simpler use cases which just require a group by that column?
- Yes exactly what I'm thinking. What if it were the same test, but users could optionally add a dimension to slice by?
Just throwing ideas out there, my real goal here is to be able to detect the kind of anomaly described in the issue description.