Help understanding why spans are being dropped
Hello, this is not a bug report but a help request. If this is not the right place I apologize in advance.
In the APM section of Kibana I see these warnings:
The APM agent that reported this transaction dropped X spans or more based on its configuration.
I've read the linked documentation and added the following environment vars:
- name: ELASTIC_APM_SPAN_FRAMES_MIN_DURATION
  value: "-1"
- name: ELASTIC_APM_TRANSACTION_MAX_SPANS
  value: "1000"
- name: ELASTIC_APM_STACK_TRACE_LIMIT
  value: "1000"
I've tried different values for ELASTIC_APM_TRANSACTION_MAX_SPANS: 1000, 2000 and 4000 but spans are still being dropped in the transactions.
My transactions are very simple, they have a dozen of spans at most. In another cluster I've running with less requests the spans are not being dropped.
How can I find the cause of the spans being dropped or the right value for ELASTIC_APM_TRANSACTION_MAX_SPANS?
If the cause were unforeseen errors like it says in the documentation what can I do to find them?
Thank you.
Environment
- OS: Debian 11 (Docker)
- Python version: 3.9.13
- Framework and version: Flask 2.1.3
- APM Server version: 7.12.1
- Agent version: 6.10.2
ELASTIC_APM_SPAN_FRAMES_MIN_DURATION and ELASTIC_APM_STACK_TRACE_LIMIT only deal with the stack frames attached to spans. Changing those config values should not affect dropped spans.
The relevant configs are ELASTIC_APM_TRANSACTION_MAX_SPANS (which you already found), and EXIT_SPAN_MIN_DURATION. You may have missed the latter config because you were browsing 7.12 documentation, which links to our (old) 5.x documentation in the python agent, and that config is fairly new.
However, EXIT_SPAN_MIN_DURATION is also disabled by default, so that's probably not the culprit either. 😅
Now that I've noticed that you're using an older stack version (7.12), I wonder if it could be our new span compression feature? Can you try setting ELASTIC_APM_SPAN_COMPRESSION_ENABLED=False and see if that resolves the issue?
You may have missed the latter config because you were browsing 7.12 documentation, which links to our (old) 5.x documentation in the python agent, and that config is fairly new.
Oops, I didn't realize. Sorry.
Now that I've noticed that you're using an older stack version (7.12), I wonder if it could be our new span compression feature? Can you try setting
ELASTIC_APM_SPAN_COMPRESSION_ENABLED=Falseand see if that resolves the issue?
I've added it but spans are still being dropped 😢 Could the issue be related to the server version?
Could the issue be related to the server version?
Good question, but no reason off the top of my head besides span compression. We only drop unsampled transactions/spans for APM Server >= 8.0, so it shouldn't be that. That said, we do always recommend upgrading when convenient. Some pretty cool features in 8.x! :)
You said the transaction has only a few spans, correct? One of my coworkers thought maybe it could manual instrumentation -- if you use capture_span() on a often-called piece of code that could result in >1000 spans and hit the limit. But it sounds like that's not your issue.
In another cluster I've running with less requests the spans are not being dropped.
Are the spans consistent enough that you could compare with another cluster and see what's being dropped? I'm a bit mystified. 😓
Sorry for the late response, I've been on holidays.
The servers in both clusters were updated to v7.17.5.
You said the transaction has only a few spans, correct? One of my coworkers thought maybe it could manual instrumentation -- if you use capture_span() on a often-called piece of code that could result in >1000 spans and hit the limit. But it sounds like that's not your issue.
I'm using capture_span() indeed. I thought that it only created 1 span. Should manual instrumentation be avoided if generates that many spans?
This is the timeline for a given transaction in the cluster where spans are being dropped:
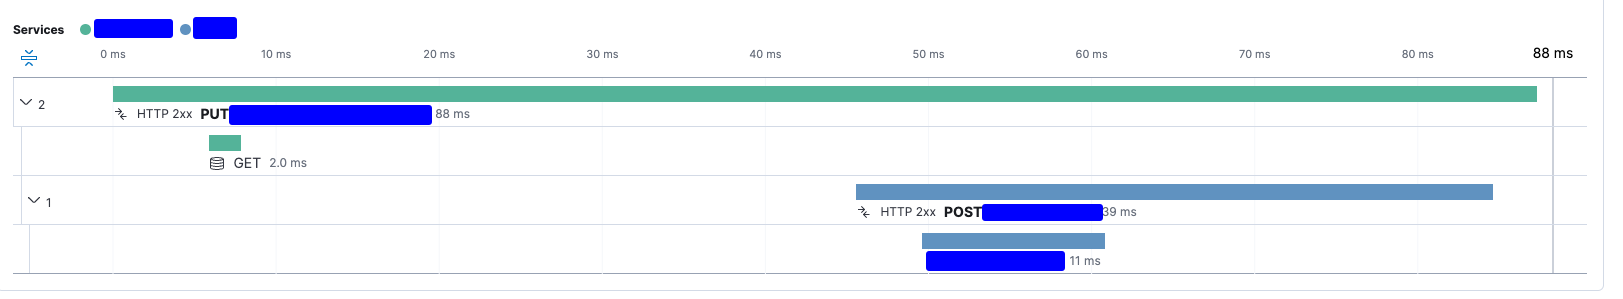
This is the analogous timeline in the testing cluster (no spans dropped):
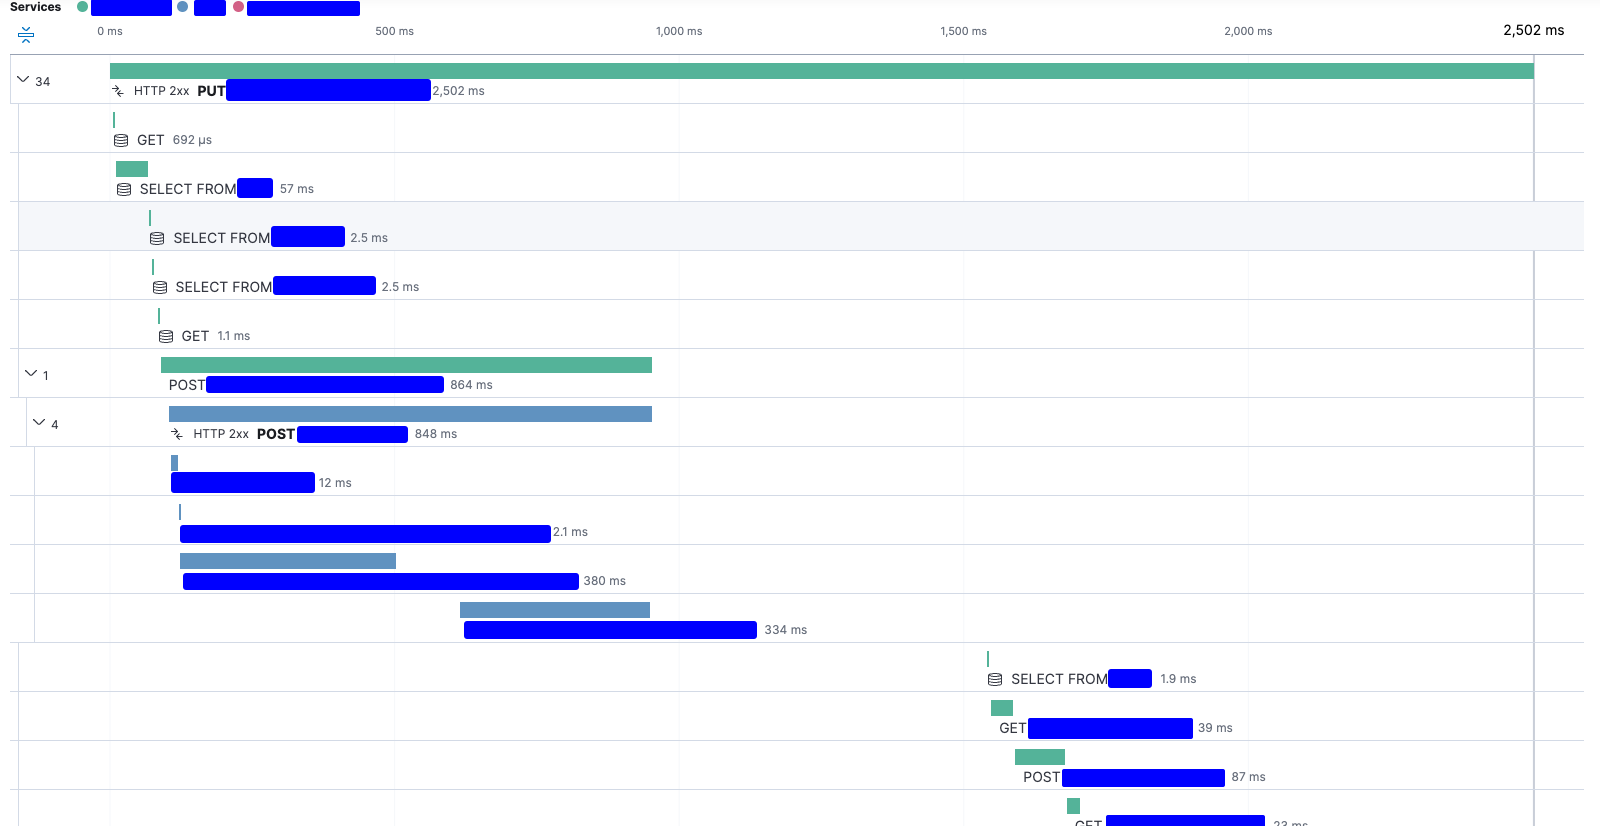
The spans being dropped are:
- First service: SQL queries after the Redis query
- Second service: manual instrumentation spans, SQL queries and HTTP requests.
I'm using
capture_span()indeed. I thought that it only created 1 span. Should manual instrumentation be avoided if generates that many spans?
The specific case to which my coworker was referring is when capture_span() is applied to a piece of code that is hit thousands of times per request. That can quickly run up against the max spans limit. But that doesn't appear to be the problem here.
In fact, I'm still quite mystified here. Does First service have any capture_span() or is it just automatic instrumentation? Looks like you're using the out-of-the-box Flask integration, yes? I assume you're also using the same SQL and HTTP libraries across the the two examples?
The first service only has automatic instrumentation. We are in the process of migrating our services from Flask to FastAPI, but the first service stills runs Flask and out-of-the-box integration. The second service uses FastAPI and out-of-the-box integration.
We use the same libraries across services (requests and SQLAlchemy) but as the first service is not yet migrated it uses older versions.
First service:
>>> requests.__version__
'2.24.0'
>>> import sqlalchemy
>>> sqlalchemy.__version__
'1.3.24'
Second service:
>>> requests.__version__
'2.28.1'
>>> sqlalchemy.__version__
'1.4.39'
Can you please set ELASTIC_APM_EXIT_SPAN_MIN_DURATION=0ms explicitly just so we can make sure that's not the culprit?
Additionally, my understanding of sqlalchemy is that it's an ORM on top of a database of your choice (using dialects). We don't instrument sqlalchemy directly -- what underlying database are you using? Is it the same across your testing cluster and the cluster where you're seeing dropped spans?
Can you also double check the elasticapm version across your two clusters to make sure we're actually on 6.10.2 everywhere?
Sorry, we are using MySQL in both clusters (same version) with pymysql:
First service:
>>> elasticapm.VERSION
'6.10.2'
>>> pymysql.__version__
'0.9.2'
Second service:
>>> elasticapm.VERSION
'6.10.2'
>>> pymysql.__version__
'1.0.2'
Can you please set ELASTIC_APM_EXIT_SPAN_MIN_DURATION=0ms explicitly just so we can make sure that's not the culprit?
Spans are still being dropped after setting the env var.
I'm still completely stumped. Can you give me all of your configuration variables (obviously redact the sensitive ones) so I can see the complete picture?
I'm still completely stumped. Can you give me all of your configuration variables (obviously redact the sensitive ones) so I can see the complete picture?
Initially we didn't have any APM variable set, now we have this:
        - name: ELASTIC_APM_SPAN_COMPRESSION_ENABLED
          value: "False"
        - name: ELASTIC_APM_SPAN_STACK_TRACE_MIN_DURATION
          value: "-1"
        - name: ELASTIC_APM_EXIT_SPAN_MIN_DURATION
          value: 0ms
        - name: ELASTIC_APM_TRANSACTION_MAX_SPANS
          value: "10000"
        - name: ELASTIC_APM_STACK_TRACE_LIMIT
          value: "1000"
I haven't forgotten you! The other dev for the python agent is coming back from leave next week, I'm going to pick his brain and see if he has any bright ideas about what's going on here.
After rubber ducking this with my coworker, we dove into Kibana to find out exactly what causes this notification:
The APM agent that reported this transaction dropped X spans or more based on its configuration.
We found it here. It's looking at transaction.span_count.dropped. This is a stat that the agent reports, and the only place it's incremented is here:
https://github.com/elastic/apm-agent-python/blob/ef9fb4ba1cf59126aff928de4e6e85d0d92933ed/elasticapm/traces.py#L288
It appears that ELASTIC_APM_TRANSACTION_MAX_SPANS is our culprit. I'm wondering if perhaps you have that config defined in central config in Kibana, in which case it would override the environment variable config. Could you check that in Kibana? If it's central config, that would explain why the issue is
It also might be useful to stick a log statement next to that line ^ and log the actual value of self.config_transaction_max_spans.
OMG! I didn't know about the central config in Kibana 🤦🏼
It seems that one of my colleagues had created a central config with a ridiculously low value for transaction_max_spans.
After changing it, everything works as expected.
Thank you very much @basepi for your help and your time! 🙇🏼