hicAggregateContacts bed format
I wasn't able to clearly understand this from the documentation.
If I have a loop file (bedpe) with the format: chr1 start1 end1 chr2 start2 end2 can I use that file directly into the --bed argument? or do I need to split that interaction file into two beds and pass it through the --bed --bed2 parameters?
If only one bed file used with the format: chr1 start1 end1 , how can true interactions be plotted if the bed files doesnt really specify what are the pairs of regions that interact with each other?
hicAggregateContacts plots the average of all sub matrices collected within the defined range.
--bed and --bed2 will plot the average of all submatrices collected for the defined range between all --bed sites and all --bed2 sites.
Currently hicAggregateContacts doesn't support the plotting of "true" interactions obtained for instance from loop detection.
You can still plot each single loop separately (--bed with the loop first anchor and --bed2 with second loop anchor).
What do you want to achieve? Average of all loops?
Hi Richard, thank you for your response. I want to use this tool to generate plots similar to Juicer_toools APA, to see an average of a given set of loops in my interaction matrix.
Can you clarify how the submatrixes are identified within a given bed file? If I have two entries in my bed files, each spanning 100kbs, would this tool plot the average of those two regions? or would it sample all matrices of a pre-defined size within each of the given ranges in the bed file?
It will collect all the submatrices corresponding to the combination of all interactions within the bed file in the given range.
If you give two bed files, it will collect and average all the submatrices of all bed1 to bed2 interactions (all rows combinations) within the specified range.
If bed file is : Chr1 3000 4000 Chr1 60000 61000
it will just look for this specific interaction (3000 to 60000, one submatrix).
If the bed file is: Chr1 3000 4000 Chr1 60000 61000 Chr1 1000000 1000000
You will consider 3000 to 60000, 3000 to 1000000 and 60000 to 1000000 (three submatrices).
And you can modulate that with the range.
The range is thus restricting which regions to regions interactions will be considered.
I think APA is doing the same, but perhaps they have a way to plot specific interactions (regions 1 to region 2, region 3 to region 4 but not regions 1 to 3 and 2 to 4).
I think we can add such support, we plan to update hicAggregateContacts anyways.
Hi Richard, I'm working on Drosophila genome and interested to plot the aggregate plot for Intra-TAD and Inter-TAD interactions. So, if I provide domains info as bed1 and bed2 interaction range, bed1 file: ChrX 3000 4000 ChrX 60000 61000 ChrX 80000 81000
bed2 file: ChrX 3000 4000 ChrX 60000 61000 ChrX 80000 81000
We will get the interactions between 3000 to 60000, 3000 to 80000 and 60000 to 81000 should be Inter-TAD interactions? (if I understand right) What I'm also interested to see the interactions within 3000 to 4000, 60000 to 61000 and 80000 to 81000 for Intra-TAD interactions. Thanks
Dear @lubna290 ,
It all depends on the range that you set.
If you want inter-tad interactions, you don't need to use 2 bed files. Simply use a single bed file so that the contacts will be aggregated between every feature in the file if the distance between them is matching the given range.
Now for comparing intra TAD vs inter TAD interactions, I don't think hicAggregateContacts is the tool that you need, since hicAggregateContacts is using focal points and their background, while what you need is a tool to delineate contacts inside TADs vs outside TADs. You can still try using TADs starts and ends as bed features and using a really low range in hicAggregateContacts. The file should look like:
Chr1 3000 3001 Chr1 4000 4001
We have an unpublished code that performs this kind of analysis but it's untested, I can still share it though if you want to give a spin.
As a published tool we have hicAverageRegions: using the TAD boundaries coordinates, you can plot the average of the contacts around them, and these check if you have a difference between sample 1 and 2.
The best way to quantify this kind of difference is still to use hicPlotDistVsCounts though: if you have a significant difference, you should be able to see it in those plots. In coordination with hicAdjustMatrix to only keep regions of potential interest (for instance differential TADs that you can get by analyzing the TADs insulation score in a one-by-one fashion between two samples).
Dear @gtrichard,
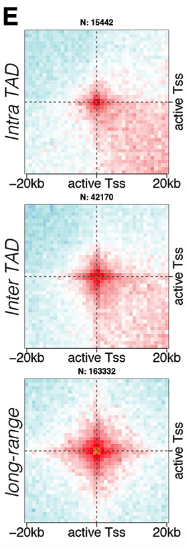
thanks for the detailed explanation and I would be happy to test your code (unpublished). I have already tested hicPlotDistVsCounts between different samples and noticed differences of interactions between different samples. So, we are very much interested to see the Inter-TAD long range interactions vs Intra-TAD interactions through aggregate analysis (example attached). I'm not good at coding (as most people used R-packages for such kind of analysis) and HicExplorer is quite handy, so I was trying to sort it out by using HicExplorer.
Currently there are no tools to get an aggregate of contacts inside and outside of TADs in HiCExplorer. Basically this requires to have groups of interactions in the bed file like:
chr1  2000    2010     TAD1
chr1  4000    4010     TAD1
chr1  8000    8010     TAD1
chr1  85000   85010    TAD2
chr1  105000  105010   TAD2
And perform the aggregation of submatrices inside or between each group.
Currently hicAggregateContacts doesn't support that. It would require a new feature development so let's see...
The unpublished code will barely help you out because it only gets the "number of contacts inside and outside TADs". So it doesn't really answer to your question (since you are interested in active TSSs contacts aggregation). So it's very rough on the edges and only give you a slight idea of what's happening. hicPlotDistVsCounts is much more precise for that endeavor (that is why the tool is not published).
You could try to get the TADs average size and set the --range below that size for "intra TADs" interactions, but you would still get some of the "between TADs" interactions, particularly between TSS located at TADs border (which is the majority of active genes location in Drosophila anyways).
For inter TAD setting a range above average TADs size would probably give you what the figure calls "long range", as you would miss interactions between TADs (+ sign here):
 /\  + /\
/  \  /  \
I guess you could try the R-package the article you took this figure from is using. HiCExplorer can convert matrices to most formats.
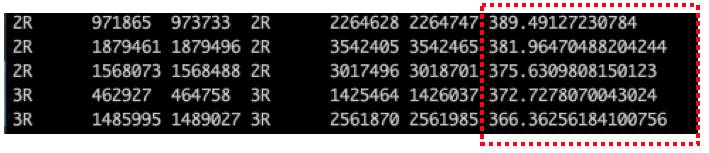
Dear @gtrichard, I have a question regarding aggregate plot output option (--diagnosticHeatmapFile). Is that possible to get the values *(in bed format) that are used for the aggregate matrix and to determine the fraction of sub-matrices that are aggregated and to show the higher enrichments at the center.
Hi @gtrichard, It's not a bug but a very basic question for general understanding regarding hicAggregate.
#/apps/python3/3.9.0/bin/python3 #/apps/hicexplorer/3.7.1/bin/hicAggregateContacts
I'm a bit confused about how exactly hicAggregate calculates the interaction between two windows saved in the 7th column (produced by --outFileContactPairs)?
 Thanks